

MONDAY STUDY – Rates To Grow Customer-Owned Resources
Smart Rate Design for Distributed Energy Resources
Mark LeBel, Jessica Shipley, Carl Linvill and Camille Kadoch, November 2021 (Regulatory Assistance Project)
Reforms to Consider and Evaluation of Potential DER Rate Design Pathways
Defining the Key Issues
With at least four important rate-making principles and numerous additional policy goals for utility regulation, sorting through the key issues can be a challenge. We suggest four primary criteria, derived from long-standing regulatory principles, by which to evaluate DER rate designs:
Fair cost allocation.
Efficient customer price signals.
Customer understanding and acceptance.
Administrative feasibility.
This is not to imply that other principles and goals are unimportant but rather that other goals are less directly affected by DER rate design (e.g., it’s likely that revenue stability would be significantly affected only in extreme cases) or require further quantitative analysis to determine (e.g., impact on DER-related jobs and industries). Progress toward the policy goal of societal equity, for example, is also possible through structural reforms. See the text box below for a discussion of equitable distribution of program benefits, particularly the potential for remedying inequity concerns through community solar.
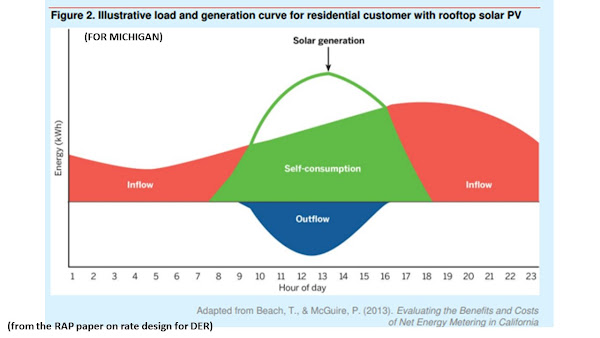
The easiest reference point for comparing our three alternative pathways below is the current inflow/outflow method and framework used in the DG program in Michigan.
 click to enlarge
Equitable distribution of program benefits
In some places with higher levels of distributed solar PV adoption, concerns have arisen that the customers adopting solar were primarily homeowners with above-average incomes and broader demographic characteristics that were not representative of the entire population. In particular, renters and other residents of multifamily buildings cannot generally install solar on their rooftops. While these concerns should be evaluated fairly, there are two ways of resolving them. One is to shut down program participation, but the other is to try to open the programs to broader public participation. This can be done through additional incentives but can also be achieved through more structural reforms. Introducing community solar, in which larger solar projects are separately interconnected to the distribution system and the utility credits subscribing customers, could be one such structural reform. Community solar customers enjoy a lower electricity bill but also make a monthly payment to the owner or operator of the community solar project, often having substantial overall net bill savings. Of course, if there are concerns about the crediting mechanism and levels for community solar projects, that raises another set of potential concerns, which was one of the significant motivations for the New York VDER tariff reforms.
In addition, it has been the case in many jurisdictions that commercial and industrial customers were also effectively prevented from meaningful participation in net metering programs, either because of size restrictions on projects or the fact that substantial demand charges for these classes meant significantly lower compensation through net metering. Reforming crediting mechanisms and other program rules to allow for comparable adoption levels by C&I customers is another way to promote an equitable distribution of program benefits.
 click to enlarge
Fair Cost Allocation
The concept of fair cost allocation typically goes back to the foundational questions mentioned earlier around the principles of cost causation and costs following benefits. Although these principles are often applied at the stage of a rate case when costs are being divided up among customer classes, they apply equally to dividing up costs among customers within a class, sometimes called intraclass cost allocation. As may be evident, the question of cost causation is typically linked to efficient marginal cost pricing; we discuss this further below.
The broader principle of “costs follow benefits” is typically applied to categories of costs that do not have a direct cost causation basis related to customer usage or other characteristics. At a minimum, this includes A&G costs and any program costs primarily motivated by societal benefits (e.g., low-income discounts), albeit under two slightly different theories. A&G costs literally benefit all customers because none of the services provided by the utility could be carried out without those costs. Programs justified by societal benefits are somewhat different because the benefits are not directly related to utility service provided to customers. Instead, broad allocation of these costs, across and within customer classes, is about shared responsibility.103 In both these cases, there is not an economically correct division of costs.
A more complex case arises in regard to elements of the electric system that do not necessarily have a direct cost-causation link to customer behavior, such as the “minimumsized distribution system” referenced in the Bonbright quote on Page 41 of this report. These costs vary most directly with the size of the area the system covers or length of the lines, a factor that is not simple to include in rates; the practice of postage stamp rates generally prohibits including it. However, there is an important sense in which different customers benefit from this distribution system backbone in proportion to their usage. With the further development of DERs and with more customers exporting to the grid, the best way to think about this phenomenon may be changing in the modern grid. In other words, the distribution system may no longer be built simply to ensure deliveries and sales, but also to support bidirectional flows.
Efficient Customer Price Signals
The principle that prices should send efficient signals to customers has long applied to customer usage, and in a modern grid this concept must be extended to a customer’s ability to store and generate electricity. According to microeconomic theory, prices are most efficient if they reflect marginal costs, although this statement glosses over many theoretical difficulties and practical disputes. For example, some analysts prefer to consider only short-run marginal costs, particularly locational marginal prices in wholesale energy markets. The better perspective is to include long-run marginal costs of generation, transmission and distribution capacity, as these costs are ultimately caused and justified by customer usage, generation and storage optimization choices. It is also generally the case that maximizing societal well-being requires the inclusion of externalities as a marginal cost. This can justify a higher assignment of residual embedded costs to certain pricing elements or the overall assessment of program costs and benefits using the societal cost test. Of course, externalities are not included directly in the cost of service, except as motivation for certain programs and various costs the utility incurs. Furthermore, the consideration of externalities in pricing has other practical consequences, including distributional impacts.
The customer behavior factors that underlie marginal cost are often referred to as cost causation, as discussed previously. From the perspective of the electric system, an additional unit of energy exported from a customer has largely the same impact as an additional unit of reduced consumption or an additional unit of generation consumed behind the meter that reduces imports, at least until the point of substantial reverse flows on elements of the grid. The marginal emissions impact, with associated environmental and public health consequences, can, however, be different, depending on the emissions profile of the distributed generation. REC policy is one way of accounting for these distinctions, which can be incorporated into DER rate design.
Cost causation, and the associated optimal marginal cost price structure, can be different for different elements of the electric system. Sending a monthly bill (either physically or electronically) has associated recurring costs that arguably fit into a customer charge. The broadly shared electric system fits well into a time-varying kWh pricing framework, although there are numerous disputes about how best to draw the connection between cost causation and workable pricing schemes. Service lines, secondary voltage lines and line transformers are mixed cases where the best proxy is subject to significant uncertainty. Depending on one’s assumptions about cost causation at this part of the system and trade-offs with other rate-making principles, these costs could be best recovered through customer charges, demand charges or kWh rates.
All deviations from efficient marginal cost pricing produce “inefficient” behavior, and any real-world pricing scheme will reflect such deviations for at least two reasons: (1) marginal cost pricing, regardless of someone’s preferred definition of marginal cost, virtually never matches the cost-of-service revenue requirement and (2) in most cases, proxies for marginal cost are often necessary instead of more precise and accurate pricing schemes, particularly for smaller and less sophisticated customers. In either case, deviation of pricing from marginal costs will cause distortionary behavior from customers, at least compared to the theoretical optimum. This is true regardless of the pricing element where a deviation is applied. For example, customer charges that are higher than marginal cost provide an inefficient incentive for customers to avoid those charges, either through formal or informal master metering or outright disconnection from the electric system. The latter possibility, also known as grid defection, was traditionally held to be unlikely, but continued cost declines for solar and storage, along with the availability of other backup generation options, may make it economically feasible for some customers in the near future. Extremely rural customers and specialized end uses (e.g., crosswalk lights and highway signs) that used to be connected to the grid have already defected to solar and storage in many places.
Customer Understanding and Acceptance
The criterion of customer understanding and acceptance for residential customers covers several related issues. To begin, basic principles of fair play in a modern marketplace dictate that customers understand what they are paying for and why. Any differences compared with what their friends and neighbors are paying should be intuitive and explainable without recourse to jargon impenetrable to the public. Furthermore, many customers are making choices within an overall budget and would like to know their options and how they can save on electricity or other utility bills.
There is also a meaningful sense in which customer understanding impacts the effectiveness of price signals built into electricity rates. Price signals can only work as intended if customers are able to respond to those incentives. Customer education, gradual introduction of reforms that build on each other, and understandable rules of thumb (e.g., consume less on hot summer afternoons) are all helpful tools to improve customer response. More sophisticated tools and efforts are possible as well. Online data provision, automated energy management technology and storage, and the availability of third-party aggregators or other energy management companies can all augment a customer’s capabilities
Administrative Feasibility
Typical utility rate-making practices across the United States today are already fairly lengthy and resource intensive, with significant administrative costs throughout the process. Introducing reforms into this process can be resource intensive as well, including the cost of new types of proceedings and new analytical requirements. Smaller reforms that make gradual changes to existing processes are likely easier to manage with little incremental costs once a clear decision has been made. However, major reforms that make serious improvement to the efficiency and equity of programs or rate structures can have benefits that justify the administrative costs. In any case, weighing these implementation concerns is important to make sure that reforms are implemented well and are not an unnecessary and unfair burden on implementing agencies or any of the stakeholders…
Potential Pathways for New Rate Designs for DERs
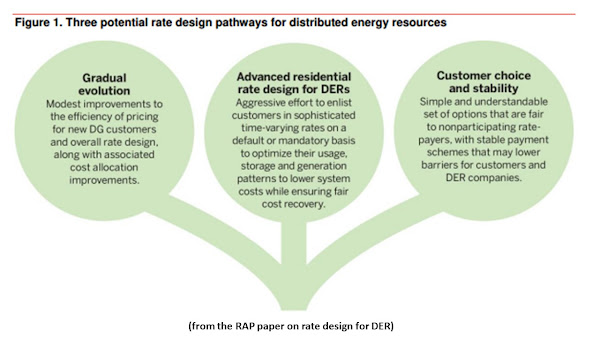
Sections 4 and 5 discussed a wide range of options for overall program structure and rate and credit design. These different options can be combined into even more overall reform packages. We present three illustrative potential pathways in this section:
Gradual evolution pathway.
Modest improvements to the efficiency of pricing for new DG customers and overall rate design, along with associated cost allocation improvements, with a minimal need for new customer education efforts, process reforms or administrative burdens.
Advanced residential rate design for DERs pathway.
An aggressive effort to enlist a large segment of residential customers in more sophisticated time-varying rates on a default or mandatory basis to optimize their usage, storage and generation patterns to lower overall system costs while ensuring fair cost recovery with new rate structures. This effort may require significant new analysis and process reforms, as well as customer education and assistance with energy management.
Customer choice and stability pathway.
A simple and understandable set of options for customers that are fair to nonparticipating ratepayers, with stable payment schemes that may lower barriers for both customers and DER companies. This model requires significant administrative efforts to determine and update value-based credits and set the grid access charge.
These three potential pathways are not exhaustive and do not even use all the program elements discussed in Section 4 or every rate design and credit option in Section 5. However, they do present coherent frameworks to illustrate key principles and trade-offs. As policymakers and stakeholders consider the best path forward for DER rate design, and electric system reform more generally, we hope that this framing illustrates key choices and how to think about constructing overall reforms…
Key State Examples
A. Duke Energy Settlement in North and South Carolina
In September 2020, Duke Energy Carolinas and Duke Energy Progress reached an agreement with solar and environmental advocates in North and South Carolina to revise the tariffs offered to residential solar customers. The development of the agreement was largely in response to South Carolina’s Energy Freedom Act (Act 62 passed in 2019) and North Carolina’s House Bill 589 (passed in 2017). In May 2021, the South Carolina Public Service Commission unanimously approved the settlement.111 The new compensation mechanism, called solar choice metering, is scheduled to apply to all new residential customers on or after January 1, 2022.
The agreement includes several key elements:
1. A minimum monthly bill of $30 for each solar choice metering customer. The agreement states that this is to ensure the utilities can recover estimated customer and distribution costs.
2. Time-varying pricing, including TOU periods and critical peak pricing, which will encourage DG customers to reduce consumption when prices are high. Customer energy imports and exports are netted within each TOU pricing tier, and monthly net exports are given a bill credit at the approved avoided cost rate. This credit can be used to reduce a customer’s bill after the minimum bill has been applied. Critical peak pricing applies to imports during specified hours, and any energy exports during those hours are netted against peak imports.
3. A monthly grid access fee for facilities larger than 15 kW.
4. Nonbypassable charges for demand-side management, energy efficiency programs, storm cost recovery and cybersecurity costs.
5. A new incentive for qualifying solar choice metering customers to enroll in the proposed smart winter thermostat program. The agreement also includes a commitment on the part of the utilities to file a broader incentive program by June 1, 2022, that includes other peak load reduction technologies that can be paired with solar.
Utility proponents of the agreement note that cost recovery from solar customers will be fairer under this structure. Duke Energy estimated that this structure would eliminate 92% or more of the current cost shift from solar owners to nonsolar owners, and the utility will be able to charge solar customers more during peak demand times when most customers are drawing a lot of power from the grid. Solar proponents note that customers whose panels can send energy to the grid during peak hours will be properly compensated, and solar customers will also be able to save money by participating in the peak load reduction aspects of the program.
B. California: From NEM 2.0 Toward NEM 3.0
California utilities have been obligated to offer a net energy metering tariff to their residential and commercial customers since the passage of SB 656 in 1995.112 From the first tariffs in 1996 up through 2016, NEM was priced at the full retail rate with an annual true-up. Rate design in California during this period was an increasing block rate with TOU tariffs offered as an option. Each utility was obligated to offer the NEM rate to all customers on a first come, first served basis until a prescribed cap was met. The cap was initially set at 0.1% of peak load but was raised several times before settling at 5% of peak load. The maximum size of NEM eligible systems settled at 1 MW.
By 2013 utility-scale solar adoption was becoming significant in California. The combination of distributed solar approaching its 5% cap and the presence of thousands of MW of utility-scale solar contributed to the emergence of the duck curve at the California ISO. Assembly Bill 327 passed in 2013 to address a perceived disconnect between the compensation being provided to solar DG adopters and the value of solar DG to California’s electric system. For the first decade of solar DG adoption, the electric system peak coincided with hours of peak solar production, making solar production valuable in addressing increasing peak loads. However, utility-scale and distributed solar collectively surpassed 20% of annual peak load, with utility-scale solar reaching 4,495 MW in 2013, while distributed PV approached its 5% cap. This dramatic increase in solar production caused the peak to shift from the afternoon to the very late afternoon and early evening. With solar production no longer coinciding with the electric system’s peak and net peak, AB 327 mandated a reconsideration of the default NEM tariff, with the new default to become effective as the 5% cap was reached in the respective utility service territories.
The California Public Utilities Commission issued Decision 16-01-044 in 2016 to implement the NEM successor tariff, commonly referred to as NEM 2.0.113 AB 327 specified some parameters for the revised NEM tariff, while others arose as the commission considered testimony and data from proceeding participants. AB 327 was concerned that NEM customers pay their share of nonbypassable expenses, which largely arise from public purpose programs incurring costs that utility ratepayers bear. These include programs like energy efficiency and low-income support. The issue of ensuring that solar adopting customers pay their share of system costs was addressed partly with this mandated feature and partly through additional features of the revised tariff, including:
A mandatory interconnection fee.
A minimum bill provision.
The phase-in of mandatory TOU rates.
NEM 1.0 customers were allowed to remain on that tariff, and NEM 2.0 customers were given a guarantee that their NEM 2.0 tariff would be available for 20 years.
Since 2016, solar has grown rapidly in California. By 2020, utility-scale solar had grown past 15,000 MW and distributed solar had surpassed 10,000 MW. The California ISO peak load is a bit less than 50,000 MW, so the 25,000 MW of solar is quite significant. In 2020, California utility regulators commissioned the Net-Energy Metering 2.0 Lookback Study to assess the performance of the NEM 2.0 tariff.114 The study indicates that further changes in the NEM framework will be needed to address persistent cost shifting. Although commercial customers do not impose a cost shift, residential customers appear to significantly underpay their share of system costs. The California commission has launched NEM 3.0 to consider additional changes in rate and tariff design to address the cost shift and to better align rate design with cost causation.
C. Arizona: Solar DG Export Tariff at the Resource Comparison Proxy
The Arizona Corporation Commission (ACC) directed its staff to begin rule-making to develop net energy metering rules in 2007.116 The commission adopted NEM rules in 2008 that provided for annual netting where any end-of-year net kWh sales would be compensated at an avoided cost rate.117 The avoided cost rate was defined to be “the incremental cost to an Electric utility for electric energy or capacity or both which, but for the purchase from the NEM facility, such utility would generate itself or purchase from another source.”118 On December 3, 2013, the ACC issued Decision No. 74022, which ordered that a generic docket be opened on net energy metering issues.
Docket E-00000J-14-0023 was opened in early 2014 to consider these issues. The ACC issued Decision No. 75859 on January 3, 2017, finding that NEM should be replaced with an instantaneous netting mechanism, known as the inflow/outflow model in Michigan, that compensates DG exports at the “actual value of DG.”119 NEM customers with an interconnection request that was filed before the effective date of the export credit tariff could remain with NEM for 20 years.
The ACC determined that the value of DG should be set at an administratively determined avoided cost and advanced two methodologies: the staff avoided cost methodology and the staff resource comparison proxy (RCP) methodology, as modified by the ACC. The staff avoided cost methodology specifies energy, generation capacity, transmission capacity and distribution capacity, line losses and environmental costs at specified levels for five years.120 The RCP methodology uses the five-year rolling weighted average of a utility’s solar power purchase agreement and utility-owned solar generating resources with additions for the benefits of avoided transmission and distribution capacity investment and avoided line losses. The ACC specified that the inputs to the avoided cost methodology be updated every year and that the methodology be considered in full with each new rate case. The five-year duration was selected to reflect an expectation that a new rate case would occur approximately every five years.
Arizona Public Service implemented the RCP methodology through its RCP Rate Rider.121 The rate rider specifies a 10-year rate (exceeding the initial five-year duration contemplated in the originating commission order) and carries the provision that the proxy will not decline by more than 10% per year. With utility-scale solar prices declining rapidly over the last five years, the 10% protection has proven important. For solar DG installed in 2017, the RCP is 12.9 cents per kWh. By 2021, the RCP declined to 9.405 cents per kWh.
Residential solar customers at Arizona Public Service have three TOU rate design options, two of which include a demand charge. Nonsolar customers have the same TOU options and two options that are not TOU.
D. Minnesota Value of Solar Tariff
Minnesota passed legislation122 in 2013 that allows investor-owned utilities to apply to the Public Utilities Commission (PUC) for a value of solar tariff as an alternative to net metering and as a rate identified for community solar gardens. The 2013 legislation specifically mandated that the VOS legislation take into account the following values of distributed photovoltaics: energy and its delivery, generation capacity, transmission capacity, transmission and distribution line losses, and environmental value. The legislation also mandated a method of implementation whereby solar customers will be billed for their gross electricity consumption under their applicable tariff and will receive a VOS credit for their gross solar electricity production. To date, the VOS tariff has only been used for Xcel’s community solar gardens, and no utility has opted in to use it for rooftop solar PV projects.
The Minnesota Department of Commerce was directed123 to establish a calculation methodology to quantify the value of distributed PV. The department submitted the draft methodology to the Minnesota PUC in January 2014.124 The PUC approved125 the methodology at a hearing on March 12, 2014, and posted the written order approving the methodology, with modifications the Department of Commerce had approved, on April 1, 2014.126
VOS Methodology and Formula
To calculate a utility’s VOS figure, several avoided cost components are each multiplied by a load match factor, if one is appropriate, and a loss savings factor. Adding the results of these separate component calculations produces the utility’s VOS figure. As a final step, the methodology calls for the conversion of the 25-year levelized value to an equivalent inflation-adjusted credit. The utility would then use the first-year value as the credit for solar customers and would adjust each year using the latest Consumer Price Index data
There are eight components of value in the tariff:
Avoided fuel cost.
Avoided plant operation and maintenance — fixed. Avoided plant operation and maintenance — variable.
Avoided generation capacity cost.
Avoided reserve capacity cost.
Avoided transmission capacity cost.
Avoided distribution capacity cost.
Avoided environmental cost.
There are two placeholder components: avoided voltage control cost and solar integration cost. These components are not part of the VOS calculation at this time, but the Minnesota Department of Commerce anticipates that these categories of costs and benefits will be known and measurable in the future.
Some key characteristics of the Minnesota VOS policy include:
Investor-owned utilities may voluntarily apply to the PUC to enact a program in lieu of net energy metering.
PV systems must be under 1 MW in size. Additionally, on-site production cannot exceed 120% of annual on-site consumption.
Customer electricity usage is separate from production.
o Customers are billed for their total electricity consumption at the retail rate.
o Compensation for the solar system is through a bill credit, at the VOS tariff rate. Net excess generation is forfeit to the utility. The utility automatically obtains the solar REC.
Value calculation:
o It is production based and expressed in dollars per kWh, levelized over 25 years.
o It is estimated as the combined value to the utility, its customers and society.
o Value calculation process:
-Once the VOS is established in any one year, that VOS is held constant for participating customers who install solar PV in that year.
-The valuation will be updated annually for new VOS participants to incorporate utility inputs for the value of PV in the year of installation.
-A utility-specific VOS input assumption table is part of the utility’s application and made publicly available.
-A utility-specific VOS output calculation table will break out the value of components and the computation of total levelized value and be made public.
o A tariff is not an incentive, and it is not intended to replace or prevent incentives. The utility automatically obtains a solar REC with zero compensation to the customer.
Evolution in VOS Methodology Components
In 2019 the PUC updated the VOS methodology for the avoided distribution capacity cost component. Since 2017, the VOS has been used as the basis for the bill credit in Xcel’s community solar garden program. In its May 1 compliance filing and its petition, Xcel argued that the current VOS methodology produces a VOS rate that is “unreasonable, unrepresentative, and clearly falls outside of the public interest.” Xcel pointed to the avoided-distribution-capacity-cost component of the methodology as the cause for volatility in the VOS rate because the component used peak demand data to arrive at the capacity cost, and peak demand is volatile year to year due to variables such as customer requirements and weather. Xcel argued that a volatile VOS rate is confusing to customers and inaccurately represents the value of distributed solar to the system, which does not significantly change from year to year.
The PUC approved Xcel’s proposal to move to a five-year average of per-kW distribution spending to calculate the avoided distribution cost for the 2020 VOS rate applied to the community solar garden program. The PUC also directed Xcel to file a framework showing how specific types of distribution projects will be categorized for future calculations of the VOS avoided-distribution-capacity-cost component. Finally, the PUC directed Xcel to discuss with stakeholders how the following could improve the VOS methodology: (1) long-term load growth assumptions, (2) sensitivity analysis of different time periods for systemwide calculation and (3) methods to de-average avoided distribution costs to account for specific location differences…
 click to enlarge
 click to enlarge
 click to enlarge
 click to enlarge
 click to enlarge
 click to enlarge
 click to enlarge
 click to enlarge
 click to enlarge
posted by Herman K. Trabish @ 6:53 AM
![]()


0 Comments:
Post a Comment
<< Home