

Monday Study – A Serious Look At A 100% New Energy Power System
Examining Supply-Side Options to Achieve 100% Clean Electricity by 2035
Paul Denholm, Patrick Brown, Wesley Cole, Trieu Mai, Brian Sergi, August 2022 (National Renewable Energy Laboratory)
Executive Summary
This study evaluates a variety of scenarios that achieve a 100% clean electricity system (defined as zero net greenhouse gas emissions) in 2035 that could put the United States on a path to economywide net-zero emissions by 2050. These scenarios focus primarily on the supply of clean electricity, including technical requirements, challenges, and benefit and cost implications. The study results highlight multiple pathways to 100% clean electricity in which benefits exceed costs. The study does not comprehensively evaluate all options to achieve 100% clean electricity, and it focuses largely on supply-side options.
 click to enlarge
This Report and the Inflation Reduction Act and the Bipartisan Infrastructure Law
The analysis presented in this report was conducted prior to the passage of the Bipartisan Infrastructure Law (BIL) of 2021 and the Inflation Reduction Act (IRA) of 2022, which include incentives for and investments in clean energy technologies along with other energy system modernization provisions. Initial analyses estimate that the energy provisions of these new laws can help lower U.S. economy-wide greenhouse gas emissions by approximately 40% below 2005 levels by 2030. 1 . The impacts of these provisions are expected to be most pronounced for the power sector, with grid emissions initially estimated to decline to 68-78% below 2005 levels by 2030 and the share of generation from clean electricity sources estimated to rise to 60-81%. Investments in end-use sector decarbonization measures, including efficiency and electrification, are also supported by the IRA provisions. While the longer-term implications of these new laws are more uncertain, they are unlikely to drive 100% grid decarbonization and the levels of electrification envisioned by 2035 in the primary scenarios analyzed in this report.
More specifically, existing state and federal policies relevant to the power sector as of October 2021 are represented in the modeled scenarios; none of the scenarios presented in this report includes the energy provisions from the IRA or BIL, or other newer enacted federal or state policies or actions. As the addition of IRA and BIL provisions are not expected to enable the U.S. power system to reach 100% carbon-free electricity by 2035, their inclusion is not expected to significantly alter the 100% systems explored in this study. As such, the study’s qualitative findings for the implications of achieving 100% are expected to still apply. However, given the potential significant impact of these new laws, the incremental differences between the Reference and 100% scenarios are expected to be lower than estimated here. Including IRA and BIL provisions would likely lower emissions in the Reference scenarios, resulting in a smaller gap between them and the 100% scenarios. As a result, the incremental electricity system costs of the 100% scenarios are expected to be lower with the inclusion of the IRA and BIL provisions. Similarly, the climate and air quality benefits of the 100% scenarios (relative to the Reference scenarios) would also be reduced. These changes have not been quantified and it is important to note that the analysis in this report does not provide any estimates of the impacts of these new laws.
 click to enlarge
100% Clean Electricity by 2035 Scenarios
We evaluated four main 100% clean electricity scenarios, which were each compared to two reference scenarios: one with “current policy” electricity demand (Reference-AEO)2 and a second with much higher load growth through accelerated demand electrification (ReferenceADE). The Reference-ADE case includes rapid replacement of fossil fuel use with low-carbon alternatives across all sectors, including electrified end uses and low-carbon fuels and feedstocks, resulting in annual electricity demand that is 66% higher than in the Reference-AEO case in 2035. The four core scenarios apply a carbon constraint to achieve 100% clean electricity by 2035 under accelerated demand electrification and reduce economywide energy-related emissions by 53% in 2030 and 62% in 2035 relative to 2005 levels.
Table ES-1 summarizes the four primary scenarios evaluated, which represent a range of uncertainties and themes (e.g., technology availability) and which are described below. In each scenario, assumptions common to all scenarios are called “reference,” and details are provided in the main body and Appendix C.
• All Options is a scenario in which all technologies continue to see improved cost and performance consistent with the National Renewable Energy Laboratory’s (NREL’s) Annual Technology Baseline (NREL 2021). This scenario includes the development and deployment of direct air capture (DAC) technology, while the other three main scenarios assume DAC does not achieve the cost and performance targets needed to be deployed at scale.3
 click to enlarge
• Infrastructure Renaissance assumes improved transmission technologies as well as new permitting and siting approaches that allow greater levels of transmission deployment with higher capacity.
• Constrained is a scenario where additional constraints to deployment of new generation capacity and transmission both limits the amount that can be deployed and increases costs to deploy certain technologies.
• No CCS assumes carbon capture and storage (CCS) technologies do not achieve the cost and performance needed for cost-competitive deployment. This scenario also acts as a point of comparison to demonstrate the potential benefits of achieving cost-competitive deployment of CCS at scale. This is the only scenario that includes no fossil fuel capacity or generation in 2035, and therefore it is the only scenario that includes zero direct GHG emissions in the electric sector.
Beyond the four core 100% scenarios, 142 additional sensitivities were also analyzed to capture future uncertainties related to technology cost, performance, and availability. Of these 142 sensitivities, 122 cases model 100% carbon-free electricity by 2035. We also evaluated all scenarios with a sensitivity case using electricity demand from the Long-Term Strategy of the United States (LTS) (White House 2021a) to reflect an alternative demand-side pathway to reaching a net-zero emissions economy by 2050. The LTS reflects higher levels of energy efficiency and demand-side flexibility, resulting in slower annual load growth of 1.8%/year (compared to 3.4%/year under ADE) and, importantly, lower demand peaks that occur predominantly in summer as compared to the sharp winter peaks assumed for our primary ADE scenarios. In addition to direct electricity demand, both ADE and LTS assumptions include demand for clean hydrogen production for transportation and industrial applications, which may be produced from electrolysis or from natural gas with CCS depending on scenario. Non-power sector demand for hydrogen is an input to the analysis; however, hydrogen demand for electricity generation (for seasonal storage) is also considered and is an outcome of the scenarios. Electricity generation and capacity needed to produce hydrogen—for both power and non-power applications—are also considered in the modeling.
Across these scenarios, this work uses NREL’s Regional Energy Deployment System (ReEDS) model to identify the resulting least-cost investment portfolios from a range of different generation, storage, and transmission technologies while considering the significant geographical variation in demand and resource availability, including the regional and temporal variations in the output of renewable resources. The geographical and temporal variability of various resources is evaluated by ReEDS, including additional transmission costs needed for remote resources and the need to maintain an adequate supply of energy during all hours of the year. A detailed list of limitations of the modeling approach and key caveats regarding scope, and cost elements included is provided in the Key Caveats section (Section 2.4, page 17).
 click to enlarge
Scenario Deployment Results
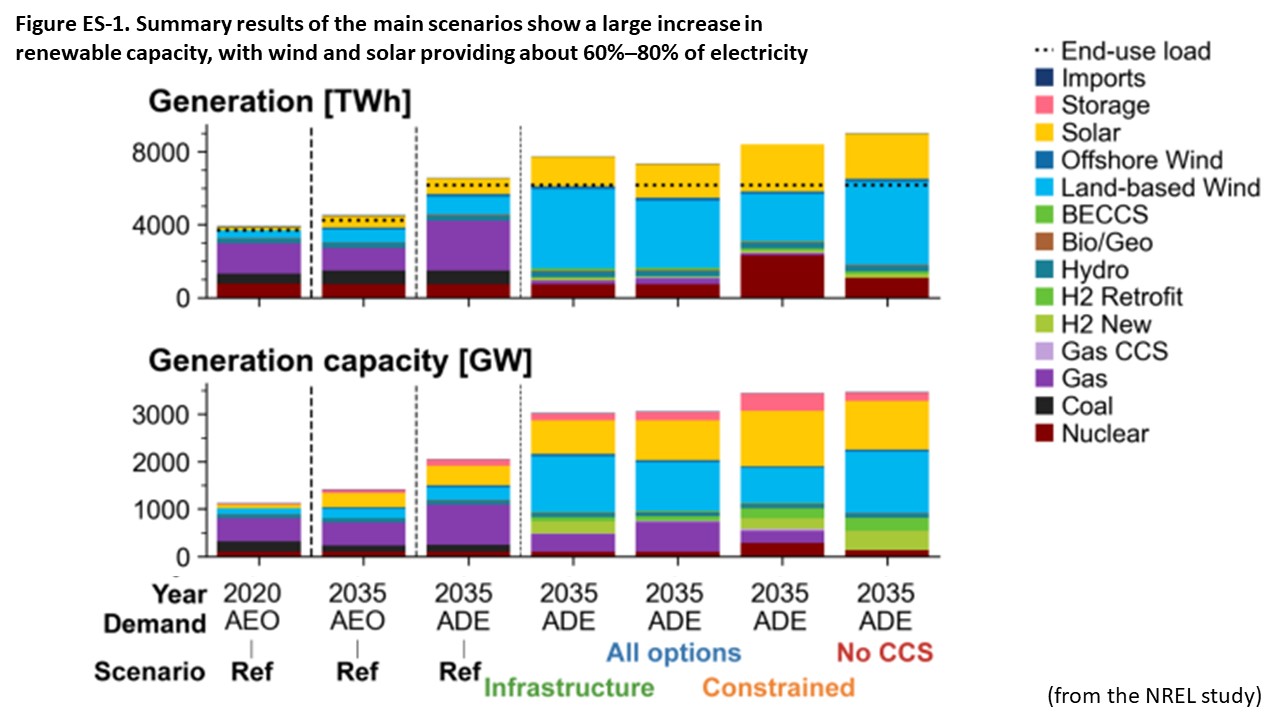
Achieving a 100% clean electricity system requires significant clean energy deployment, and a summary of the results from the 100% scenarios is provided in Figure ES-1, including generation capacity, annual generation, average annual installation rate, and transmission capacity. graphic
Based on assumed growth in demand due to end-use electrification, and electric demand associated with hydrogen production (for direct use or for production of other clean fuels), total electricity generation grows by about 95%–130% from 2020 to 2035. Total generation is shown for all end-use loads (dotted line in Figure ES-1Figure ) plus the additional generation needed for transmission losses and generation used by the electric sector to produce hydrogen for seasonal electricity storage. There are differences between scenarios in absolute amounts of generation based on differences in storage (and associated losses) and hydrogen production. The need for new generation capacity would be even higher without the energy efficiency and demand-side flexibility measures assumed in the ADE trajectory. Results from the LTS sensitivity cases result in a 16%–20% reduction in the need for new installed capacity compared to the ADE cases due, in part, to the higher levels of energy efficiency assumed in LTS.
Wind and solar provide most (60%–80%) of the generation in the least-cost electricity mix in all the main scenarios. Nuclear capacity more than doubles in the Constrained scenario, reaching 27% of generation, while limited growth in the other three core scenarios results in a contribution of 9%–12%, largely from the existing fleet. The overall generation capacity grows to roughly three times the 2020 level by 2035, including a combined 2 TW of wind and solar. This would require growth rates in the range of 43–90 GW/year for solar and 70–145 GW/year for wind by the end of the decade, which would more than quadruple the current annual deployment levels for each technology in many scenarios. Across the four core scenarios, 5–8 GW of new hydropower is deployed by 2035 by adding capacity at unpowered dams and uprates at existing facilities, while geothermal capacity increases by about 3–5 GW by 2035.
Differences in energy contribution among the four core scenarios are largely driven by constraints in transmission and renewable siting. In all scenarios, significant transmission is constructed in many locations, and significant amounts are deployed to deliver energy from wind-rich regions to major load centers in the eastern United States. Total transmission capacity (which is a mix of AC and HVDC depending on scenario) in 2035 is 1.3–2.9 times current capacity. Beyond already planned additions, these total transmission builds would require 1,400– 10,100 miles of new high-capacity lines per year, assuming new construction began in 2026.5 ***The Infrastructure Renaissance scenario constructs the most transmission and wind, and it results in the lowest average system cost…
Based on assumed cost declines of renewable energy technologies, the pathway to achieving roughly 90% clean electricity is fairly consistent across the scenarios, and wind and solar provide the most generation in three of the scenarios, supplemented by significant nuclear deployment in the Constrained scenario. The variation between the scenarios is largely focused on the specific technologies that can most cost-effectively meet peak demand and can contribute to the last 10% of clean generation. This is reflected largely in the differences in capacity contribution among the four scenarios, which are driven by multiple factors, including uncertainty about technology availability at scale in the coming decades.
The main uncertainty in reaching 100% clean electricity is the mix of technologies that achieves this target at least cost—particularly considering the need to meet peak demand periods or during periods of low wind and solar output. The analysis demonstrates the potentially important role of several technologies that have not yet been deployed at scale, including seasonal storage and several CCS-related technologies. The mix of these technologies varies significantly across the scenarios evaluated depending on technology cost and performance assumptions…
 click to enlarge
Benefits and Costs of 100% Clean Electricity
Achieving 100% clean electricity produces benefits that, in most scenarios, outweigh the additional direct costs relative to a reference scenario. Figure ES-4 (top) shows the reduction in fossil fuel use. Compared to Reference-AEO, the electrification that occurs in the ReferenceADE scenario leads to substantial reductions in (1) petroleum use in transportation and (2) natural gas in buildings and industry by 2035. Moving to the 100% clean electricity scenarios further reduces fossil fuel use in the power sector.9 This fossil fuel reduction leads to a 54% reduction in GHG emissions compared to 2020 (bottom). Reduction of particulates, SO2, and other emissions in the electric sector leads to an estimated 40,000–130,000 avoided premature deaths between 2020 and 2035 due to improved air quality.
Figure ES-5 compares the system costs against a limited set of emissions-related benefits. System costs include capital, fixed, and variable costs associated with generation and transmission, but they do not include administrative costs or costs of maintaining or upgrading the distribution system. The figure shows an estimate of the net present value of the evaluated costs and benefits from 2023 to 2035, presented as differences between the 100% scenarios and Reference-ADE. The left bar in each scenario represents the system costs with a negative value (meaning additional cost) of $330 billion to $740 billion, which represents the additional costs of achieving 100% clean electricity compared to the Reference-ADE scenario.
The Constrained and No CCS scenarios have the greatest increase in direct costs…All the core scenarios (and sensitivities) produce benefits that exceed costs, even when using the lower SCC values…
 click to enlarge
Implications and Future Research
The rapid reduction in the costs of renewable and several other clean energy technologies over the past two decades allows for continued large-scale deployments that are expected to generate benefits that substantially outweigh the associated power system cost, assuming these technology cost declines continue in the coming decades. However, achieving the transformation of the U.S. energy system to 100% clean electricity as envisioned in these scenarios requires four challenging actions to occur in the next decade:
1. Dramatically accelerating electrification and increasing the efficiency of the demand sectors to get the country on the path to net-zero emissions by midcentury. Electrification will dramatically increase demand, which in turn may make it more difficult to decarbonize the electricity system due to the higher rate of generation and transmission capacity additions needed. However, electrification of end uses in buildings (with a critical parallel focus on efficiency of those end uses) and much of transportation and industry is likely a key part of the most cost-effective pathway to achieving largescale decarbonization across the economy. Furthermore, a parallel focus on efficiency and flexibility of end uses has the potential to greatly impact generation supply needed. More flexible operation could provide higher utilization of generation, transmission, and distribution assets, lowering the delivered cost of electricity. To achieve decarbonization of all energy sectors by 2050, further electrification, low- to zero-carbon fuel production, energy efficiency, and demand flexibility measures will be needed.
2. Installing new energy infrastructure rapidly throughout the country. This includes siting and interconnecting new renewable and storage plants at rates of three to six times recent levels, potentially doubling or tripling the capacity of the transmission system, upgrading the distribution system, building new pipelines and storage for hydrogen and CO2, and/or deploying nuclear and carbon management technologies with low environmental disturbance and in an equitable fashion to all communities.
3. Expanding clean technology manufacturing and the supply chain. The unprecedented deployment rates for clean electricity technologies envisioned in the 100% scenarios requires a corresponding growth in raw materials supply, manufacturing facilities, and trained workforce throughout the supply chain. Further analysis is needed to understand how to achieve the scale-up of manufacturing as part of a just transition to a clean electricity system. This includes evaluating the economic and energy security benefits of increasing domestic manufacturing.
4. Accelerating research, development, demonstration, and deployment to bring emerging technologies to the market. Technologies that are being deployed widely today can provide most U.S. electricity by 2035 in a deeply decarbonized power sector. A 90% clean grid can be achieved at low incremental cost by relying primarily on new wind, solar, storage, advanced transmission, and other technologies already being deployed at scale today. However, the path from 90% to full decarbonization is less clear, as many of the technologies that could best aid full decarbonization, such as clean hydrogen and other low-carbon fuels, advanced nuclear, price-responsive demand response, CCS, and DAC, have not yet been deployed at large scale. A concerted research, development, demonstration, and deployment effort is needed to reduce costs and improve performance to enable these technologies to be commercialized at scale and support a fully decarbonized grid.
This ambitious list of tasks will require explicit support to be achieved in the coming decade. Failing to achieve any of these actions could increase the difficulty of realizing a 100% clean grid by 2035. However, damages from climate change are not binary, so even if emissions reductions fall short of those envisioned in the scenarios here, significant harm to human health, economies, and the ecological system can be avoided by making progress toward decarbonization…
posted by Herman K. Trabish @ 6:23 AM
![]()


0 Comments:
Post a Comment
<< Home