

Monday Study – Solar’s Growth, Market Share Up-Up-Up
Tracking the Sun, 2022 Edition
Galen Barbose, Naïm Darghouth, Eric O’Shaughnessy, and Sydney Forrester, September 2022 (Lawrence Berkeley National Laboratory)
Summary Brief
Berkeley Lab’s annual Tracking the Sun report describes pricing and design trends among grid-connected, distributed solar photovoltaic (PV) systems in the United States. This summary brief provides an overview of key trends from the latest edition of the report, based on project-level data for roughly 2.5 million systems installed through year-end 2021, and preliminary data for the first half of 2022. New to the report this year is an expanded coverage of paired PV-plus-storage systems, including details on system design and pricing trends…
 click to enlarge
PV System Characteristics
Characteristics of projects in the data sample help to illustrate trends within the broader U.S. market and provide context for understanding installed price trends. Key technology and market trends based on the full data sample are as follows.
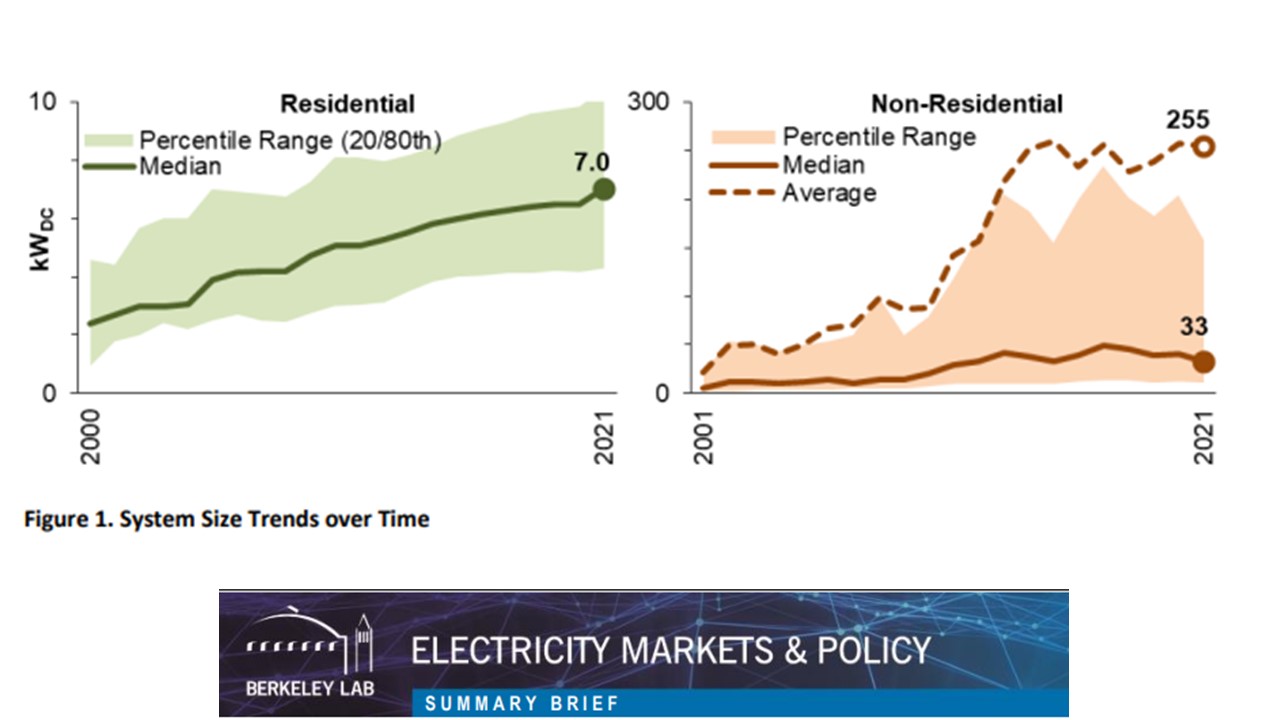
• Residential PV systems continue to grow in size, with median sizes in 2021 reaching 7.0 kW, while nonresidential system sizes have plateaued (see Figure 1). For the purpose of this report, non-residential systems are defined to include roof-mounted systems of any size and ground-mounted systems up to 5 MWAC. Most are relatively small, with a median of just 33 kW in 2021, but roughly 20% were larger than 150 kW, and the average size among all non-residential systems was roughly 250 kW
• Module efficiencies have risen steadily over time: for example, among residential systems, median module efficiencies rose from 13.6% in 2002 (the earliest year with sufficient data) to 20.1% in 2021, with similar rises for non-residential systems as well.
 click to enlarge
• Module-level power electronics (either microinverters or DC optimizers) have continued to gain share across the sample, representing 94% of residential systems, 81% of small (75%) of non-residential site hosts, with the remainder consisting of some combination of tax-exempt customers (schools, government, nonprofits). As to be expected, TPO is considerably more prevalent among tax-exempt site hosts than for commercial hosts (35% vs. 16% in 2021).
• Inverter-loading ratios (the ratio of module-to-inverter nameplate ratings) have generally grown over time, and are slightly higher for large non-residential systems (a median of 1.22 in 2021) than for residential and small non-residential systems (1.18 and 1.17, respectively).
• Roughly half (46%) of all large non-residential systems installed in 2021 are ground-mounted, and 12% have tracking. In comparison, 13% of small non-residential and 2% of residential systems are ground-mounted, and negligible shares have tracking.
 click to enlarge
• Panel orientation has remained fairly consistent in recent years, with 54% of systems installed in 2021 facing southward (180±45 degrees), 24% to the west, and most of the remainder to the east.
• Third-party ownership (TPO) in the residential sample, which includes both leasing and power purchase agreements, has declined over time from a high of 59% of systems installed in 2012 to 28% in 2021. For the non-residential sample, TPO shares have remained comparatively steady and have historically been lower for small vs. large non-residential systems (14% vs. 33% in 2021). In general, TPO shares tend to be higher in states with richer incentives.
• For-profit commercial customers make up the largest share (>75%) of non-residential site hosts, with the remainder consisting of some combination of tax-exempt customers (schools, government, nonprofits). As to be expected, TPO is considerably more prevalent among tax-exempt site hosts than for commercial hosts (35% vs. 16% in 2021).
 click to enlarge
Paired PV+Storage System Characteristics
This year’s edition of an expanded discussion of trends among paired PV+storage systems, including details on battery storage attachment rates (the percentage of PV installations each year that include storage) and system sizing.
• Battery storage attachment rates have been steadily rising in the residential sector, reaching 10.0% of the data sample in 2021 (see Figure 2, left). Non-residential attachment rates are lower and have fluctuated over the years, but have been rising recently, reaching 4.9% of all systems installed in 2021.
• National storage attachment rates largely reflect California, given its large share of the overall market. Hawaii has, by far, the highest attachment rates of any state (93% residential, 59% non-residential in 2021). Other lesser pockets of activity exist in both the residential and non-residential markets. For example, following Winter Storm Uri in Texas, PV+storage adoption rose rapidly, with attachment rates in CenterPoint’s service territory averaging 14% over the year and trending upward.
• Storage retrofits onto existing PV systems represented about 15% of all paired residential systems installed in 2021, and 9% of non-residential systems. Retrofit applications are significantly more common in California than in most other states.
• Paired residential systems continue to evolve toward larger storage sizing over time, likely reflecting an increasing focus on backup power applications. Among paired residential systems installed in 2021, roughly 42% had batteries of at least 10 kW in size.
• In contrast, paired non-residential systems are getting smaller, as uptake expands among smaller customers into applications beyond demand charge management. Of all paired non-residential systems installed in 2021, almost half (46%) had batteries smaller than 10 kW.
 click to enlarge
Median Installed-Price Trends
The installed price data summarized in the report represent prices paid by system owners prior to receipt of any incentives, and are based on a subset of the larger dataset, consisting of only host-owned systems and, unless otherwise noted, only stand-alone PV systems (without batteries).
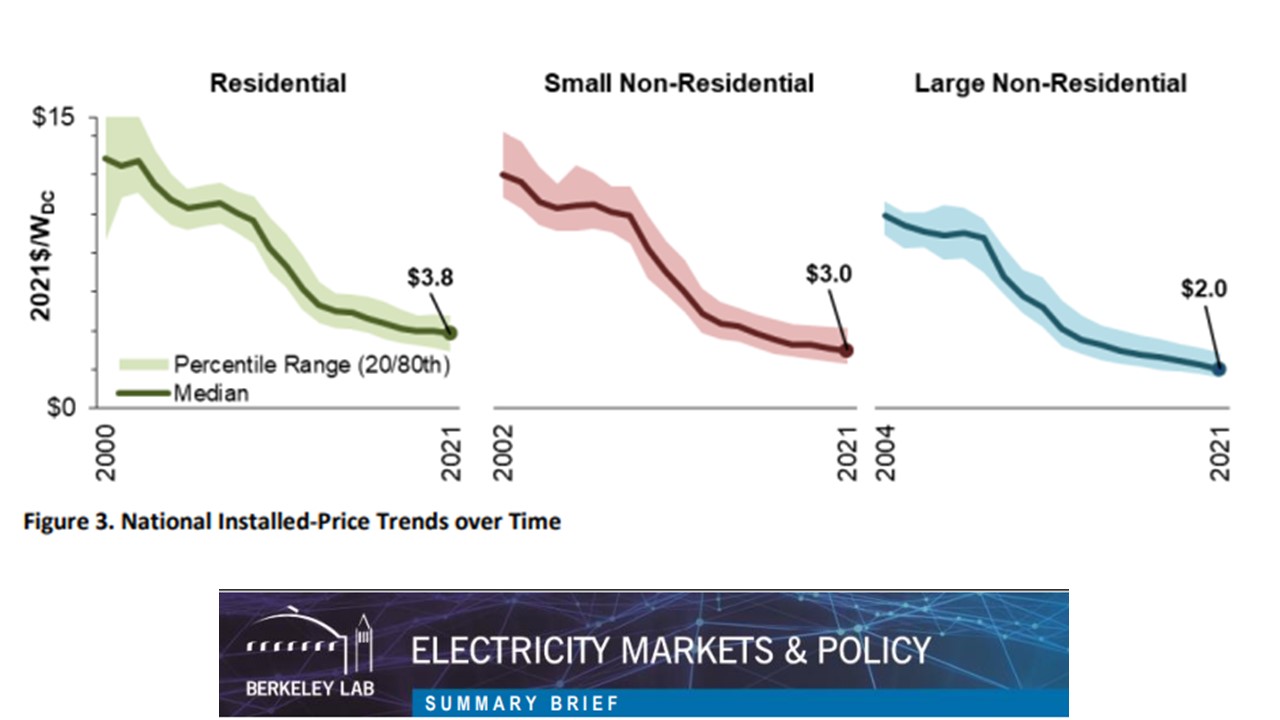
• Over the long-term, U.S. median installed prices have fallen by roughly $0.4/W per year, on average, but that price decline has tapered off since 2013, with prices dropping since then at roughly $0.1-0.2/W per year (see Figure 3). Over the last year of the analysis period (2020-2021), median prices fell by $0.1- 0.2/W across all three sectors (in real, inflation-adjusted terms), maintaining recent historical trends. The YoY decline in total installed prices occurred despite a slight uptick in module costs.
• Preliminary data for systems installed in the first half (H1) of 2022 show that median installed prices for residential systems remained flat (in real terms) compared to the last half of 2021, and continued to fall for non-residential systems. Supply chain constraints, widely acknowledged within the industry as putting upward pressure on prices, may not be fully reflected in prices for installed projects, and are also partly embedded within the inflation adjustment of pricing data into real dollar terms. In nominal terms, median prices residential and large non-residential systems rose in H1 2022.
• Year-over-year (YoY) pricing trends at the state-level can deviate from national trends, with half of all states showing an increase in median residential prices from 2020-2021, and most states showing a decline in non-residential prices. Over the past 5 years, trends across states are more uniform, with typically a $0.1-0.2/W average annual decline in median residential prices and an annual decline of $0.1-0.3/W in non-residential prices.
• National median installed prices from the Tracking the Sun dataset are higher than a number of other common PV pricing benchmarks, which generally align more closely with the 20th percentile levels from Tracking the Sun. These differences reflect a diversity of methods, data sources, and definitions. As one specific example, prices reported for loan-financed systems in the Tracking the Sun dataset may include dealer fees, which other benchmarks typically do not include, and may add upwards of 10-25% to the total up-front price paid by the customer.
• Median prices for PV systems paired with battery storage were $0.6-1.6/W higher than for stand-alone PV systems in 2021, across the three customers segments shown in Figure 4. Using a multi-variate regression analysis, we estimate roughly a $1.9/WPV premium for adding storage to residential PV, assuming a 5-kW battery with 10-15 kWh of storage. Given typical residential PV and storage sizes, this equates to an underlying incremental cost of roughly $1200/kWh of storage, which is in-line with average residential storage costs reported through California’s Self-Generation Incentive Program.
 click to enlarge
Variation in Installed Prices
While trends in median installed prices can be revealing, the installed pricing data also exhibit substantial variability across projects, as shown in Figure 5 below, reflecting underlying differences in project-level characteristics, installer attributes, and features of the local market, policy, and regulatory environment.
• Installed prices within each customer segment vary substantially depending on system size, with a difference of $1.1/W in median prices between the smallest and largest residential systems, and $2.0/W between the smallest and largest non-residential systems.
• Installed prices vary widely across states, with state-level median prices ranging from $2.9-4.8/W for residential, $2.1-3.3/W for small non-residential, and $1.5-2.7/W for large non-residential systems. A small part of this state level variation can be explained by feature of local PV markets that are modeled as part of the regression analysis, as discussed below.
• Across the top-100 residential installers in 2021 (by volume), installer-level median prices generally ranged from $3-5/W, and most had a median price above $4.0/W.
• Within the non-residential sector, installed prices are higher for systems installed at tax-exempt customer sites, compared to prices for commercial site hosts, though this seems to be uniquely the case in California, which represents a large share of the market. Differences were most pronounced for large non-residential systems in California, where tax-exempt customers paid a median price of $3.3/W in 2021, compared to $1.9/W for commercial customers.
The full report also provides descriptive trends comparing median installed prices based on module efficiency and the use of MLPEs, though those pricing differences tend to be relatively small and are more clearly defined through the regression analysis below.
 click to enlarge
Regression Analysis of Pricing Variability
We apply a multi-variate linear regression model to estimate the effects of individual factors on installed prices, focusing on host-owned residential PV systems installed in 2021, and including both stand-alone PV and paired PV+storage systems. This statistical model includes variables related to system, market, and installer-level characteristics, as well as state- and quarterly fixed effects variables. Key results from this analysis, as depicted in Figure 6, include the following.
• Of the system-level pricing drivers, battery storage has by far the biggest effect ($1.9/W), though microinverters, DC-optimizers, ground-mounting, and new construction all have relatively large effects ($0.4-0.5/W) as well.
• Effects associated with the various market- and installer-related drivers are all relatively small (less than $0.2/W), but in general are directionally intuitive
• Of particular note is the wide range across the state fixed-effects variables ($1.6/W), suggesting the presence of strong state-level pricing drivers beyond those explicitly captured in the model (e.g., costof-living, retail rates, incentives, solar insolation, permitting processes)…
posted by Herman K. Trabish @ 6:29 AM
![]()


0 Comments:
Post a Comment
<< Home