

Monday Study – The Costs And Benefits Of Connecting New Generation
Interconnection Cost Analysis in the Midcontinent Independent System Operator (MISO) Territory; Interconnection costs have escalated as interconnection requests have grown
Joachim Seel, Joe Rand, Will Gorman, Dev Millstein, and Ryan Wiser, October 2022 (Lawrence Berkeley National Laboratory); Will Cotton, Nicholas DiSanti, and Kevin Porter (Exeter Associates)
Executive summary
Interconnection queues have grown dramatically throughout the United States. In MISO, the cumulative capacity of projects actively seeking interconnection more than doubled from 2016 through 2021. Based on available data on project-level interconnection costs from MISO, our analysis finds:
• Average interconnection costs have grown. Project-specific costs can differ widely depending on many variables. We focus on average costs as a key cost metric. For projects that have completed all required interconnection studies (dubbed “complete” request status), average costs have nearly doubled (to $102/kW) for more recent projects relative to costs from 2000-2018 ($58/kW). Projects still actively moving through the queue (“active”) have estimated costs that have more than tripled just over the last four years, from $48/kW to $156/kW (2018 vs. 2019-2021).
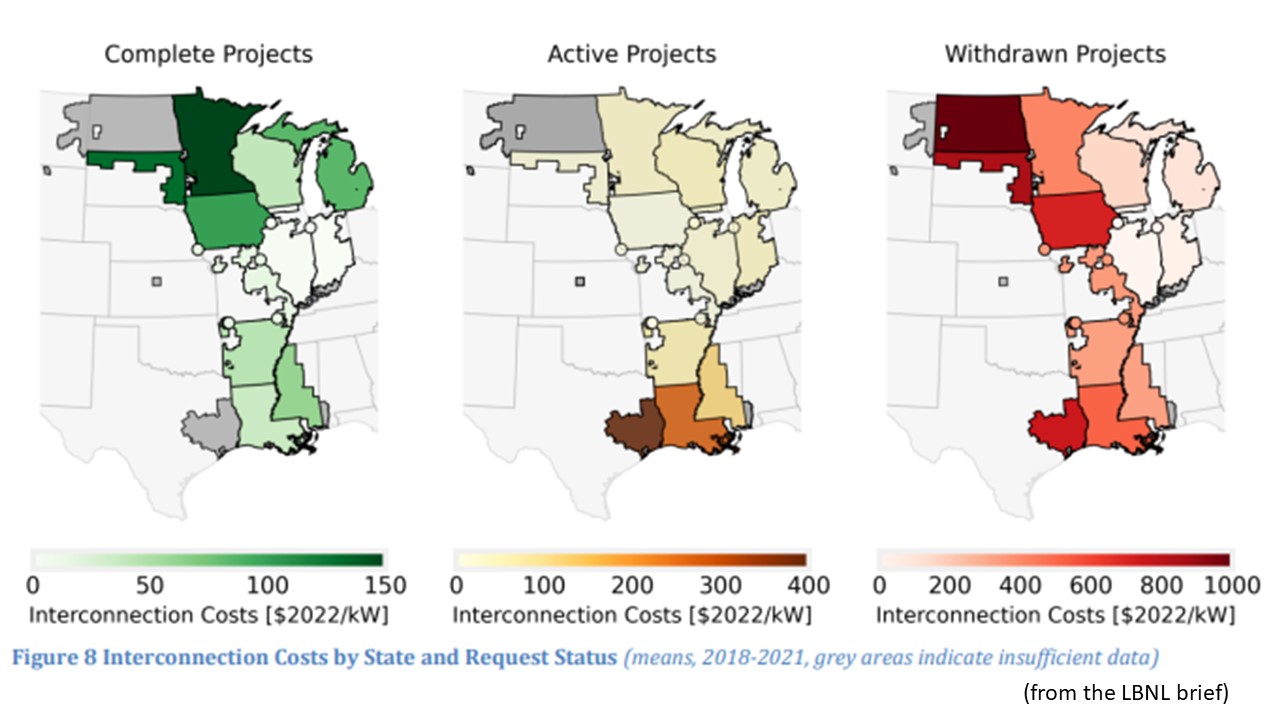
• Projects that have completed all required interconnection studies have the lowest costs. Costs averaged $102/kW for complete projects from 2019 through 2021. Projects that are actively progressing through the study process but have not yet completed all studies have higher costs ($156/kW), while the interconnection requests that ultimately withdraw from the queue (“withdrawn”) face the highest costs ($452/kW)—likely a key driver for those withdrawals.
• Broader network upgrade costs are the primary driver of recent cost increases. Costs for local facilities at the point of interconnection are similar for complete ($46/kW) and active ($48/kW), but larger for withdrawn projects ($67/kW). Costs for broader network upgrades beyond the interconnecting substation explain most cost differences and have risen sharply. Estimated network upgrade costs have grown since 2018, to $57/kW for complete projects and $107/kW for active projects. Among withdrawn projects, they make up 85% of the costs at $388/kW for recent projects.
 click to enlarge
• Potential interconnection costs of wind ($399/kW), storage ($248/kW), and solar ($209/kW) have been greater than natural gas ($108/kW) projects in recent years (2018-2021). Wind projects bear the greatest costs compared to other resource types: Wind projects that completed the interconnection study process in 2021 faced a record average of $252/kW, nearly four times the historical average and about 16% of typical total wind installation costs in MISO. Wind projects that ultimately withdrew had average interconnection costs of $631/kW (equivalent to 40% of total project installed costs), compared with $358/kW (or 24% of installation costs) for withdrawn solar applicants.
• Larger generators have greater interconnection costs in absolute terms, but economies of scale exist on a per kW basis. Medium-sized wind ($491/kW) and solar ($259/kW) projects face twice the potential interconnection costs per unit of capacity compared to very large wind ($222/kW) and solar ($125/kW) projects.
• Interconnection costs also vary by location, with projects in the eastern part of MISO (Indiana and Illinois) reporting overall lower costs, irrespective of request status ($50-70/kW). Applicants in the north (North and South Dakota) and parts of Texas have high potential interconnection costs (average of $508-915/kW).
The cost sample analyzed here represents nearly 50% of all projects requesting interconnection from 2010 to 2020, or 30% when going further back in time to the year 2000. While it is sufficiently robust for detailed analysis, much data remains unavailable to the public. The paucity of easily accessible interconnection cost data poses an information barrier for prospective developers, resulting in a less efficient interconnection process. We have posted project-level cost data from this analysis at https://emp.lbl.gov/interconnection_costs.
 click to enlarge
1. The interconnection queue doubled in capacity over the past few years
As of the end of 2021, the Midcontinent Independent System Operator (MISO) had over 160 gigawatts (GW) of generation and storage capacity actively seeking grid interconnection. This “active” capacity in MISO’s queue is dominated by solar (112 GW) and, to a lesser extent, wind (22 GW) power capacity. MISO’s queue also contains additional data for projects that are no longer actively seeking interconnection: 366 GW of projects have withdrawn their application and 62 GW of projects are already in service (Rand et al. 2022). Submissions for MISO’s 2022 Generator Interconnection Queue again broke all records, increasing by 220% over 2021 levels. If all submissions are accepted as valid, the active MISO queue would balloon to 289 GW, more than 95% of which are either renewable power or energy storage (MISO 2022). The capacity associated with these requests is more than twice as large as MISO’s peak load in recent years (about 120 GW) and, if substantial amounts are built, will likely exert competitive pressure on existing generation. However, most projects have historically withdrawn their applications: only 24% of all projects requesting interconnection between 2000 and 2016 have ultimately achieved commercial operation at the end of 2021.
MISO has implemented numerous interconnection process reforms since 2008 to reduce queue delays and project cancellations. These reforms, for example, shifted MISO’s procedures for processing interconnection requests away from a “first-come, first-served” serial approach to a “first-ready, first-served” cluster study approach with annual cluster windows in each of the five MISO regions. In 2016, MISO introduced new “at risk” payments to enhance project readiness at interim milestones and, starting with the 2020 queue cycle, MISO established more stringent site control requirements for projects to progress through the queue (Bergan et al. 2012; Caspary et al. 2021). MISO has also increased efforts to expand the transmission network. The ISO recently approved $10 billion of new bulk transmission, while their Joint Targeted Interconnection Queue initiative aims to invest $1 billion to address transmission needs along the MISO-SPP seam.
 click to enlarge
2. Cost sample represents nearly 50% of projects requesting interconnection over the past decade
This brief analyzes interconnection cost data from 922 projects that were evaluated in interconnection studies between 2001 and 2021, equivalent to 28% of all projects requesting interconnection to the MISO system during that time (see left panel in Figure 1); the cost sample increases to 48% of projects when focusing on a more recent time period of 2011 through 2020.
Our interconnection cost sample has two sources:
• All data that were available in the MISO system as of February 2022: 698 projects (MISO 2022).
• Data for 224 additional projects that were already collected in 2018 and that had since been removed from the online MISO system (Gorman, Mills, and Wiser 2019).
While the sample is sufficiently robust to enable detailed analysis of interconnection costs, it represents a subset of all projects. MISO removes detailed interconnection study information after a few years from their publicly accessible records, explaining the paucity of data for earlier years. We were also not able to analyze costs for projects entering the queue in 2021 and beyond as interconnection studies with cost estimates are performed and published with some delay. The lack of easily accessible interconnection cost data poses an information barrier for prospective developers, resulting in a less efficient interconnection process. We have posted project-level cost data from this analysis at https://emp.lbl.gov/interconnection_costs.
The sample varies over time with respect to request status (see right panel in Figure 1). Data for completed projects goes back furthest in time and makes up the largest portion of our cost sample (370 projects, 56.9 GW). Some projects ultimately withdraw from the interconnection process for a variety of reasons; our data includes 314 such projects (48.1 GW) that were studied between 2018 and 2021. Projects that are still active in the interconnection study process were primarily evaluated in 2021 (total of 238 projects, 37.8 GW).
 click to enlarge
3. Interconnection costs have grown, driven by network upgrade expenses
Interconnection cost data were collected manually from public interconnection study reports, using the most recent study type available (feasibility studies, system impact studies, and addendums). The interconnection cost data summarized here are based exclusively on cost estimates in interconnection study reports and do not include potential additional interconnection-related expenses that may be borne by a project developer. We assume the reported costs refer to nominal dollars as of the time of the interconnection study and present costs in real $2022-terms based on a GDP deflator conversion. We present interconnection costs in $/kW to facilitate comparisons, using the nameplate capacity of each project…
 click to enlarge
3.1 Average interconnection costs have grown over time…3.2 Broader network upgrade costs are the primary driver of recent cost increases…3.3 Interconnection costs for wind, storage, and solar are larger than for natural gas…3.4 Larger generators have greater interconnection costs in absolute terms, but economies of scale exist on a per kW basis…3.5 Interconnection costs vary by location…
posted by Herman K. Trabish @ 7:20 AM
![]()


0 Comments:
Post a Comment
<< Home