Trevor Noah On The Grid
New Energy, with a renewed transmission and distribution system, can become tomorrow’s power system. From The Daily Show with Trevor Noah via YouTube
posted by Herman K. Trabish @ 6:33 AM
0 comments
![]()
Gleanings from the web and the world, condensed for convenience, illustrated for enlightenment, arranged for impact...
The challenge now: To make every day Earth Day.

YESTERDAY
THINGS-TO-THINK-ABOUT WEDNESDAY, August 23:
THE DAY BEFORE
THE DAY BEFORE THE DAY BEFORE
WEEKEND VIDEOS, July 15-16:
THE DAY BEFORE THAT
WEEKEND VIDEOS, July 8-9:
THE LAST DAY UP HERE
WEEKEND VIDEOS, July 1-2:
--------------------------
--------------------------
Founding Editor Herman K. Trabish
--------------------------

--------------------------
WEEKEND VIDEOS, June 17-18
email: herman@NewEnergyNews.net
-------------------
-------------------
-------------------
Pay a visit to the HARRY BOYKOFF page at Basketball Reference, sponsored by NewEnergyNews and Oil In Their Blood.
New Energy, with a renewed transmission and distribution system, can become tomorrow’s power system. From The Daily Show with Trevor Noah via YouTube
posted by Herman K. Trabish @ 6:33 AM
0 comments
![]()
Denmark will proceed with a $34 billion investment to build energy islands in the North Sea for harvesting ocean wind.From OBF via YouTube
posted by Herman K. Trabish @ 6:33 AM
0 comments
![]()
From VROOOM to zooooom; 1000 HP, 0 to 60 in 3 seconds, major torque, 4-wheel steering and all with 100 mile charging in 120 minutes watt-power. From GMC via YouTube
posted by Herman K. Trabish @ 6:32 AM
0 comments
![]()
Climate change is a ‘global emergency’, people say in biggest ever climate poll
27 January 2021 (UN News)
The People’s Climate Vote poll from the UN Development Programme (UNDP), described as the biggest climate survey yet conducted, showed urgent climate action has broad support amongst people around the globe, across nationalities, age, gender and education level, according to UNDP Administrator Achim Steiner. The survey covered 50 countries and over 50% of the world’s population. It showed people around the world want climate-friendly farming, protections to nature, and investments in a green recovery from COVID-19.
The poll asked respondents if climate change was a global emergency and whether they supported 18 climate policies covering the economy, energy, transport, food and farms, nature, and population protections. It targeted 1.2 million people, including over half a million people under 18 with innovative approaches like distribution through mobile gaming networks. People supported ‘broad climate policies’ beyond the current situation.
A majority in eight of the ten survey countries with the highest emissions from the power sector backed more renewable energy. The survey found a direct link between education level and support for climate action…and found that people under 18 were more likely to say climate change is an emergency, though 65% of those 18-35, 66% of those 36-59, and 58% over 60 agreed. click here for more
posted by Herman K. Trabish @ 8:19 AM
0 comments
![]()
UN offers science-based blueprint to tackle climate crisis, biodiversity loss and pollution
18 February 2021 (UN News)
Humanity’s ‘senseless and suicidal war on nature’ has resulted in ‘three interlinked environmental crises’ according to UN Environment Programme (UNEP) Secretary-General António Guterres. The climate disruption, biodiversity loss and pollution that ‘threaten our viability as a species’ are detailed in UNEP’s just released Making Peace with Nature.
It shows that ‘human well-being lies in protecting the health of the planet,’ Guterres said. Two-thirds of global CO2 emissions are linked to households, which is part of the environmental cost from growing the global economy nearly fivefold in the past five decades.
Global warming is on track to increase by 3°C this century, pollution-driven diseases are responsible for some nine million premature human deaths a year, and over a million plant and animal species are at risk of extinction. Women are 80% of those displaced by climate disruption, water pollution kills 1.8 million a year, largely children, 1.3 billion are poor, and 700 million are hungry. Change will require integrating nature’s value into policies and economic choices. click here for more
posted by Herman K. Trabish @ 8:19 AM
0 comments
![]()
Utility customers owe up to $40B in COVID-19 debt, but who will pay it? Shutoff moratoria have provided a reprieve for some on 2020 power bills, but still-mounting debt needs forgiveness or securitization, analysts say.
Herman K. Trabish, Dec. 3, 2020 (Utility Dive)
Editor’s note: The bill has mounted since this piece was written.
Shutoff moratoria across the country, allowing COVID-impacted residential and small business customers to defer utility payments without the threat of losing service, have been invaluable to millions, authorities on energy bill assistance say. But when the vaccines are dispensed and the pandemic fades, any economic recovery will be impacted by potentially huge debts to utilities, debts that have yet to be addressed anywhere, experts said. State regulators will decide whether the indebted customers, all utility customers, investors, taxpayers — or some combination of those groups — should pay this bill.
Residential and small business customers could owe "$35 billion to $40 billion dollars to their utilities by March 2021," according to National Energy Assistance Directors' Association (NEADA) Executive Director Mark Wolfe. "Our new arrearage data shows that by then, individual unpaid bills may be as high as $1,500 to $2,000, which is as much as some customers pay for electricity in a year."
Utilities have done remarkable things to keep customers' lights on and "just get through the pandemic," spokespeople for San Diego Gas & Electric (SDG&E), Duke Energy and other utilities said. But policymakers and regulators must now plan to get working-class families the debt forgiveness that businesses and institutions got from the federal government's paycheck protection programs, Wolfe said.
"The reality is that someone is going to pay," said University of Florida Public Utility Research Center Director of Energy Studies Theodore J. Kury. Policymakers' and regulators' choices include requiring payment from indebted customers, shifting the debt to utilities and their ratepayers, imposing it on taxpayers, or some combination. Although there may eventually be some good from the decision — like a better understanding of the effectiveness of moratoria or an improved relationship between utilities and their customers — they now must choose "how and when people pay," he added.
Starting in March, many states and utilities suspended power shut-offs for nonpayment. State-mandated or voluntary utility shut-off moratoria are now in place for 51% of the U.S. population (167 million people) across the country through Jan. 31, 2021, according to NEADA data from November.
As a result, utilities are seeing diminished revenues as they face unexpected expenses. The pandemic "required us to dramatically adjust how we operate," Duke spokesperson Neil Nissan said. Like many utilities, Duke suspended disconnections for unpaid bills and waived late and other fees. The utility also helped customers enroll in local payment programs, the federal Low-Income Home Energy Assistance Program (LIHEAP) or state and local assistance programs, including Duke Energy Foundation-funded local assistance agencies. Duke expects COVID-reduced load, along with diminished revenues from waived payments and fees to lead to $0.25 to $0.35 in reduced earnings per share for 2020, which "equates" to estimated losses of $180 million to $260 million, Nissan said… click here for more
posted by Herman K. Trabish @ 6:31 AM
0 comments
![]()
The Texas Power Crisis, New Home Construction, and Electric Heating; No U.S. state has built as many new homes as Texas over the last decade and most of them use electric heat.
Lucas Davis, February 22, 2021 (Energy Institute at Haas/U.C. Berkeley)
“…[In the deadly Texas power outages, there were power plant outages, freezing natural gas pipelines, and] reduced wind and nuclear generation…[but] Texas demand was able to reach 69 gigawatts in the winter… Between 2010 and 2019, 1.5 million new housing units were constructed in the state. Over this time period the population of Texas grew 15%, adding almost 4 million people… In 1950, less than 1% of Texas homes used electricity as their primary heating fuel…and 61% in 2018…The single most important factor is low electricity prices. The average residential price for electricity in Texas is less than 12 cents per kilowatt hour, below the national average and way below states like California (19 cents)…
...[A] single home can easily use 5000 watts for heating. Many Texas homes use much more…7 million homes multiplied by 5000 watts yields 35 gigawatts…[With electric water heating and the rest of residential load, plus commercial and industrial,] you get to 69 gigawatts…[T]he Texas market last week was not up to the task…While wholesale prices in the Texas market climbed last week to $9,000/MWh, the overwhelming majority of electricity customers in Texas continued to pay retail prices close to $120/MWh, barely 1/100th of the true marginal cost…Not seeing these high prices, Texas consumers had little incentive to conserve…
Dynamic pricing allows customers to pay lower prices throughout 99% of the year, in exchange for facing much higher prices when supply is tight. Numerous studies have documented that dynamic pricing yields substantial demand reductions…With 28GW of forced outages in Texas last week, it is unlikely that dynamic prices alone could have closed the gap between demand and supply. But dynamic pricing is the fastest and cheapest way to build flexibility into the market, and can play an important role moving forward.” click here for more
posted by Herman K. Trabish @ 6:30 AM
0 comments
![]()
Carbon‐Neutral Pathways for the United States James H. Williams, Ryan A. Jones, et.al, 14 January 2021 (Advancing Earth and Space
Science)
Abstract
The Intergovernmental Panel on Climate Change (IPCC) Special Report on Global Warming of 1.5°C points to the need for carbon neutrality by mid‐century. Achieving this in the United States in only 30 years will be challenging, and practical pathways detailing the technologies, infrastructure, costs, and tradeoffs involved are needed. Modeling the entire U.S. energy and industrial system with new analysis tools that capture synergies not represented in sector‐specific or integrated assessment models, we created multiple pathways to net zero and net negative CO2 emissions by 2050. They met all forecast U.S. energy needs at a net cost of 0.2–1.2% of GDP in 2050, using only commercial or near‐commercial technologies, and requiring no early retirement of existing infrastructure. Pathways with constraints on consumer behavior, land use, biomass use, and technology choices (e.g., no nuclear) met the target but at higher cost. All pathways employed four basic strategies: energy efficiency, decarbonized electricity, electrification, and carbon capture. Least‐cost pathways were based on >80% wind and solar electricity plus thermal generation for reliability. A 100% renewable primary energy system was feasible but had higher cost and land use. We found multiple feasible options for supplying low‐carbon fuels for non‐electrifiable end uses in industry, freight, and aviation, which were not required in bulk until after 2035. In the next decade, the actions required in all pathways were similar: expand renewable capacity 3.5 fold, retire coal, maintain existing gas generating capacity, and increase electric vehicle and heat pump sales to >50% of market share. This study provides a playbook for carbon neutrality policy with concrete near‐term priorities.
Plain Language Summary
We created multiple blueprints for the United States to reach zero or negative CO2 emissions from the energy system by 2050 to avoid the most damaging impacts of climate change. By methodically increasing energy efficiency, switching to electric technologies, utilizing clean electricity (especially wind and solar power), and deploying a small amount of carbon capture technology, the United States can reach zero emissions without requiring changes to behavior. Cost is about $1 per person per day, not counting climate benefits; this is significantly less than estimates from a few years ago because of recent technology progress. Models with more detail than used in the past revealed unexpected synergies, counterintuitive results, and tradeoffs. The lowest‐cost electricity systems get >80% of energy from wind and solar power but need other resources to provide reliable service. Eliminating fossil fuel use altogether is possible but higher cost. Restricting biomass use and land for renewables is possible but could require nuclear power to compensate. All blueprints for the United States agree on the key tasks for the 2020s: increasing the capacity of wind and solar power by 3.5 times, retiring coal plants, and increasing electric vehicle and electric heat pump sales to >50% of market share.
Introduction
The Paris Agreement calls for “holding the increase in the global average temperature to well below 2°C above pre‐industrial levels and pursuing efforts to limit the temperature increase to 1.5°C (UNFCCC, 2015).” Moreover, avoiding the worst impacts of climate change may require not only staying below 1.5°C but a return to 1°C by 2100 (Hansen et al., 2013). Climate outcomes of 2°C, 1.5°C, and 1°C are associated with end of century atmospheric CO2 concentrations of roughly 450, 400, and 350 ppm, respectively, entailing global net CO2 emissions trajectories that reach zero by roughly 2070, 2055, and 2040 and are negative thereafter (Hansen et al., 2017; IPCC, 2018).
This paper examines specific pathways by which emissions reductions consistent with these trajectories can be achieved in the United States. We focus on reductions in energy and industrial (E&I) CO2, which constitutes more than 80% of current gross U.S. greenhouse gas (GHG) emissions (U.S. EPA, 2019a). We combined our modeled results for E&I with published values for non‐CO2 GHG emissions and the land CO2 sink to obtain a range of economy‐wide CO2e values for comparison to global trajectories and policy targets adopted by United States and other jurisdictions, including “80% by 2050,” “net zero by 2050,” and “350 ppm by 2100” (Le Quéré et al., 2018; U.S. Climate Alliance, 2020).
Our objective in this paper was to develop realistic deep decarbonization scenarios that reach net zero or net negative E&I CO2 emissions by 2050 while meeting all forecast demand for energy services at the lowest possible cost, using only technologies that are commercial or have been demonstrated at large pilot scale. The scope of the analysis includes all energy flows through the U.S. economy, from primary energy inputs, such as petroleum and natural gas, to energy conversion processes, such as oil refining and power generation, to end uses in buildings, transportation, and industry that consume final energy in the form of electricity and solid, liquid, and gaseous fuels. We modeled the transition pathways in all these areas in detail to answer high‐level questions of interest to policy makers—technical feasibility, infrastructure requirements, cost, the implications of different assumptions and tradeoffs, and the required types and scale of policy interventions—as well as technical questions of interest to specialists, for example, how to optimally integrate high levels of variable renewable energy (VRE), produce low‐carbon fuels from biomass and electricity, decarbonize challenging end uses in industry and freight transport, and incorporate carbon capture, utilization, and storage (CCUS) into the overall E&I system (Bataille, 2020; Davis et al., 2018; Dessens et al., 2016; Rogelj et al., 2015)…
The Low‐Carbon Transition…Four Pillars of Deep Decarbonization
The emissions objectives were reached in all scenarios, while meeting all energy needs. As in previous deep decarbonization pathways studies, the transition from a high‐carbon to a low‐carbon energy system was based on the strategies of (1) using energy more efficiently, (2) decarbonizing electricity, and (3) switching from fuel combustion in end uses to electricity (Bataille et al., 2016; White House, 2016; Williams et al., 2012, 2015). Since the emissions reduction impacts of these strategies are multiplicative, they must be simultaneously applied to achieve their full potential. This study further shows that reaching net zero E&I emissions, including non‐energy CO2 from industrial processes, requires an additional strategy: (4) capturing carbon, which can either be sequestered geologically or utilized in making carbon‐neutral fuels and feedstocks (section 7.3) (Haley et al., 2018). Benchmark values for the four strategies are shown in Figure 2 (Figure S11). Per capita energy use declined 40% in 2050 compared to 2020, and energy intensity of GDP declined by two thirds. The carbon intensity of electricity was reduced 95%, while electricity's share of end use energy tripled, from 20% to 60%, including electrically derived fuels. Carbon capture reached almost 800 Mt CO2/year, up from negligible levels today; of this, about 60% was utilized and about 40% was geologically sequestered. >p>
Metrics for the four main strategies of deep decarbonization, 2050 central case compared to current levels.
The energy system transformation resulting from applying the four strategies is shown for two bookend cases in Figure 3. The 100% renewable primary energy case has no fossil fuels remaining in 2050, while the central case with low fossil fuel prices has the highest residual fossil fuel use. In both scenarios, both primary and final energy uses are lower in 2050 than in today's system, despite meeting higher energy service demand due to rising population and GDP. The shares of coal, oil, and natural gas in primary energy supply decrease dramatically from today's level, replaced primarily by wind, solar, and biomass.
Low‐carbon electricity and fuels replace fossil fuels in most final energy uses.
Conversion processes that currently play a minimal role—biomass refining and production of hydrogen and synthetic fuels from electricity—become important in the decarbonized energy system, replacing most or all petroleum refining (Figures S1–S4). Contrasts between the decarbonized cases are discussed in section 5.3 (Table 2).
Sankey diagrams for (top) the current U.S. energy system, (middle) the central carbon‐neutral case with low fossil fuel prices, and (bottom) the 100% renewable primary energy case. Primary energy supplies are on the left, conversion processes in the middle, and final energy consumption on the right. Line widths are proportional to magnitude of energy flows.
Infrastructure Changes
Deep decarbonization entails an infrastructure transition over the next three decades in which high‐emitting, low‐efficiency, and fuel‐consuming technologies are replaced by low‐emitting, high‐efficiency, and electricity‐consuming technologies, at the scale and pace necessary to reach the emission targets (Davis et al., 2010, 2018; Davis & Socolow, 2014; Shearer et al., 2020). The required scale and pace are illustrated in Figure 4 for three sectors that together comprise two thirds of current E&I CO2 emissions: electric power generation, vehicles, and space and water heating in buildings (Figures S12–S14 and S22) (U.S. EPA, 2019a). By 2050, electric generation capacity increased by 3,200 GW; virtually all of the net increase was wind and solar (section 6.4). Coal was fully retired. Out of 296 million cars and light trucks, more than 280 million were battery electric vehicles. In residential buildings, electric heat pumps constituted 119 million out of 147 million space heating units and 88 million out of 153 million water heating units, with electric resistance heaters comprising most of the remainder. This transition was accomplished over a period of 30 years by replacement of equipment at the end of its normal lifetime, without early retirement.
Alternate Pathways
The constrained scenarios demonstrate that feasible alternate pathways to the same carbon target exist even in the face of limits on technology choices and resource availability. However, these scenarios required compensating changes in other areas, resulting in higher net cost and greater use of other resources (Table 2):
Low land…Delayed electrification…Low demand…100% renewable primary energy…Net negative…
Cost
The levelized net energy system cost of this transformation for the central case was $145 billion in 2050, equivalent to 0.4% of GDP in that year (Figures 5 and S7–S10). This is the difference in the annualized capital and operating costs of supplying and using energy in the central case compared to the reference case, plus the net cost of reducing or offsetting non‐energy industrial process emissions. Except where noted, cost inputs were the reference values of DOE long‐term fossil fuel price and technology cost forecasts (NREL, 2019; U.S. EIA, 2019). The net present value of net system cost was $1.7 trillion over the 2020–2050 period, using a 2% societal discount rate. In the central case, increased spending on incremental capital costs for low‐carbon, efficient, and electrified technologies ($980 billion in 2050) was offset by reduced spending on fossil fuels and incumbent technologies (−$835 billion in 2050). A sensitivity case using the DOE low fossil fuel price forecast raised the central case net cost to 1.2% of GDP in 2050 (net cost is higher because the counterfactual reference case cost is lower); using the low technology cost forecasts for renewables lowered it to 0.2% of GDP. The net costs of all other scenarios ranged from about 0.45% in the low land case up to 0.9% in the 100% renewable primary energy case. The net negative case consistent with a 1°C/350 ppm trajectory had a net cost of less than 0.6% of GDP in 2050….
Electricity…Electricity Generation
Until recently, it was unclear whether VRE, nuclear, or fossil fuel with CCS would become the main form of generation in a decarbonized electricity system. Analyses of U.S. economy‐wide deep decarbonization (~80% GHG reductions) have generally shown roughly equal shares of generation from each of these sources, with the proportions changing depending on policy and cost assumptions (Bistline et al., 2018; Clarke et al., 2014; White House, 2016; Williams et al., 2012, 2015). The cost decline of VRE over the last few years, however, has definitively changed the situation.
Our analysis shows that electricity from VRE is the least‐cost form, not only of power generation but of primary energy economy wide, even when that requires investment in complementary technologies and new operational strategies to maintain reliability. All cost‐minimizing pathways to deep decarbonization are organized around using VRE to the maximum feasible extent, to supply both traditional loads and new loads such as EVs, heat pumps, and hydrogen production. As a result, electricity demand increases dramatically, to roughly three times the current level by 2050 (230% to 360% across cases; Figure 6b and Table 2). This demand is met primarily by VRE in all cases. In the central case, the generation mix was 90% wind and solar (Figure 6a); the minimum level was 81% in the limited‐land case (Figures S23–S25 and S27). It is possible that dramatic cost breakthroughs in new generating technologies such as Allam Cycle CCS and Gen IV nuclear could result in a reduced VRE share, but the breakthroughs would need to happen soon in order to deploy them at the pace and scale required in these scenarios.
There has been a vigorous debate over the feasibility of electricity systems with very high levels of VRE generation…The provision of reliable capacity (MW) in a decarbonized electricity system is fundamentally separate from the provision of energy (MWh)…Transmission…Batteries…
Conclusions
Carbon Neutrality Is Affordable
We have shown that achieving net zero and net negative CO2 emissions from energy and industry in the U.S. by mid‐century can be done at low net cost. Recent declines in solar, wind, and vehicle battery prices have made decarbonizing the U.S. economy increasingly affordable on its own terms, without counting the economic benefits of avoided climate change and air pollution (Garcia‐Menendez et al., 2015; Hsiang et al., 2017; Nemet et al., 2010; West et al., 2013; Risky Business Project, 2016). The net cost of deep decarbonization, even to meet a 1°C/350 ppm trajectory, is substantially lower than estimates for less ambitious 80% by 2050 scenarios a few years ago (Clarke et al., 2014; Williams et al., 2015); even with decarbonization, future energy costs as a share of GDP are expected to be lower than today's.
Renewable Electricity Is the Foundation of an Affordable Transition
The least‐cost decarbonized electricity system combines high VRE generation (>80% share) with low‐cost reliable capacity such as natural gas without carbon capture operating infrequently. If renewables and transmission cannot be built at the scale required, for example, due to difficulty in siting, nuclear and fossil CCS generation become important. Implementing high VRE systems may require changes in wholesale electricity markets to allow cost recovery for thermal generation needed for reliability but operated <15% of the time and to provide incentives for industrial loads such as electrolysis and electric boilers to operate flexibly on renewable over‐generation (Jones et al., 2018).
The Social Effects of Changes in the Energy Economy Need to Be Managed
Deep decarbonization entails a major shift in the U.S. energy economy. The variable costs of fossil fuels will be replaced by the capital cost of low‐carbon technologies. Incremental capital investment averaging $600B per year represents about 10% of current U.S. annual capital investment of $6 T in all sectors, indicating that finance per se is not a barrier if policies that limit risk and allow cost recovery are in place (Federal Reserve Bank of St. Louis, 2019). A greater challenge is likely to be the political economy of effectively redirecting >$800B/year from fossil fuels into low‐carbon technologies. The distributional impacts of such a transition could be ameliorated through policies that support communities and sectors dependent on fossil fuel extraction, while new jobs emerge under policies that ensure a significant domestic share of the manufacturing‐based low‐carbon economy (Busch et al., 2018).
Consumer Incentives Are Needed to Support Timely Electrification
Carbon neutrality is aided by complete consumer adoption of electric end use technologies in light‐duty transportation and buildings. Slow adoption that leads to delayed or incomplete electrification will result in greater cost and resource use. Direct mandates and/or carbon prices can drive decarbonization of electricity and fuels production, since utilities and industrial enterprises are responsive to such signals. Different policies may be required to influence consumers who are sensitive only to upfront cost. As demonstrated historically with solar PV, one option is customer incentives such as rebates that effectively lower the purchase price of EVs and heat pumps. These have the potential to dramatically increase sales, drive innovation, reduce manufacturing costs, and lower purchase prices in a self‐sustaining market transformation (Nemet, 2019).
Recognizing Tradeoffs Between Decarbonization Strategies Is Essential
The scale and pace of infrastructure buildout and demands on the land in a low‐carbon transition imply competition among social, environmental, and economic priorities. Our scenarios illustrate the kinds of tradeoffs that can be anticipated and their impacts. The use of biomass and of land for renewable siting are indispensable for all net zero pathways, but the amount required can differ by a factor of 2 or more. It needs to be understood that reducing biomass and land for siting implies increasing fossil fuels, nuclear power, and negative emissions. In addition to siting and biomass, increasing the land carbon sink is another element of the competing priorities among climate mitigation, food production, and other land uses (Griscom et al., 2017).
Given the regional character of energy use and resources and the U.S. system of government, many of the tradeoffs faced will need be resolved at the state and local level (Betsill & Rabe, 2009; Williams et al., 2015). Rigid positions on tradeoffs will not be helpful for informed decision‐making as they may lead to over‐constrained problems and policy paralysis; better public participation, analysis, and data are more likely to improve outcomes. Recent work in California, where conflicts between renewables siting, biodiversity conservation, and agriculture have emerged, points to the potential of incorporating geospatial analysis into energy planning to help reconcile competing land uses in large‐scale wind, solar, and transmission buildouts (Wu et al., 2016, 2020).
The Actions Required in the Next 10 Years Are Known With High Confidence
Carbon‐neutral pathways diverge in energy strategy, resource use, and cost primarily after 2035. The highest‐priority near‐term actions are similar across pathways and have clear quantitative benchmarks for policy: renewables build‐out (>500 GW total wind and solar capacity by 2030); coal retirement (<1% of total generation by 2030); maintaining current nuclear and natural gas capacity; and electrification of light‐duty vehicles (EVs > 50% of LDV sales by 2030) and buildings (heat pumps >50% of residential HVAC sales by 2030). Longer‐term uncertainties are related mainly to fuels and CCUS, areas in which technical potential, costs, and environmental impacts at large scale need to be better known before specific strategies are adopted. There is time for society to explore different approaches to these questions and learn from the results before solutions are needed in bulk in the 2030s, but the solutions will only be ready if the preparatory work—R&D, demonstrations, early commercial subsidies—is begun now. In other words, taking decisive near‐term action in the areas that are well understood, combined with laying the necessary groundwork in the areas of uncertainty, puts the United States on a carbon‐neutral pathway right away while allowing the most difficult decisions and tradeoffs to be made with better information in the future.
posted by Herman K. Trabish @ 6:54 AM
0 comments
![]()
Renewables had little to do with what happened in Texas this week. It was an almost complete failure of state leaders’ choices about how to run the Texas energy system. Will this turn anything else blue besides Texans’ lips? From MSNBC via YouTube
posted by Herman K. Trabish @ 7:36 AM
0 comments
![]()
His call for innovation is justified but accelerated and smart investment in the tools now in place will serve for a good 10 years.From 60 Minutes via YouTube
posted by Herman K. Trabish @ 7:35 AM
0 comments
![]()
As demand grows, all resources become crucial to keeping the lights on. From greenmanbucket via YouTube
posted by Herman K. Trabish @ 7:34 AM
0 comments
![]()
Bill Gates: These 5 concepts will help you understand the urgency of the climate crisis
Catherine Clifford, February 14, 2021 (CNBC)
“…[In] How to Avoid a Climate Disaster,” billionaire Bill Gates shares five basic concepts that have helped to frame his understanding of the pending climate crisis…51 billion tons of greenhouse gasses are added to the atmosphere each year…[Gates writes that any green technology or policy impact should be] based on what percentage of 51 billion tons of GHG it can remove from the atmosphere…
Making things, like cement and steel [31% of GHGs], is more of a culprit than…Electricity: 27%...Growing things, including plants and animals: 19%...Transportation, including planes, trucks and cargo ships: 16%...[and] heating, cooling and refrigeration: 7%...It takes 5,000 gigawatts it takes to power the world…[including] Mid-size city: 1 gigawatt…Small town: 1 megawatt…Average American household: 1 kilowatt…
…[But it] all comes back to money…Green or clean energy solutions, are more expensive than using fossil fuels. Gates calls it the “green premium.” For each energy source, the green premium will be different. (In very rare cases, it can be negative…And since carbon emissions are a global problem, it’s key to consider what is affordable for all countries, not just the wealthy ones, Gates says.” click here for more
posted by Herman K. Trabish @ 7:38 AM
0 comments
![]()
Why Clean Energy Now
Phillip Brzenk, 3 February 2021 (S&P Global)
“…[P]ower generation coming from renewable sources, such as wind, solar, hydro, and geothermal, should provide the majority of the world’s energy needs by 2050…[Its use] has been increasing significantly over the last decade…The primary driver behind the shift from traditional energy sources, such as petroleum, natural gas, and coal, to renewables comes from a “critical mass” of governments around the world looking to adopt policies that seek to lower the global carbon footprint…
…[Most notably, the landmark Paris Agreement] calls to keep the increase in global average temperature to well below 2°C above pre-industrial levels and aims for a climate-neutral world by mid-century…Come 2050, electricity generation from renewables is expected to come from a well-diversified mix led by solar, wind, and hydro…[T]he clean energy push clearly needs to be a global phenomenon, as the growth in consumption through 2050 will primarily be from non-OECD countries…
With the surge in demand for renewable energy, companies in the clean energy space are poised for similar growth…[The] S&P DJI offers the S&P Global Clean Energy Index, which provides liquid and tradable exposure to 30 leading clean energy companies…[and] attempts to represent the full clean energy ecosystem by including companies both on the production and the technology & equipment sides in the various segments of renewable energy across the globe.” click here for more
posted by Herman K. Trabish @ 7:38 AM
0 comments
![]()
100 Billion Greenbacks for a Green California Recovery
Herman K. Trabish, Oct. 5, 2020 (California Current)
Editor’s note: With the Biden administration talking about “building back better,” this might help with budget planning.
“…[The need for economic stimulus] is “beyond paramount” and it should include “a comprehensive suite of ideas, including investing in advanced technologies,” said Sen. Robert Hertzberg (D-Van Nuys)… AB 841, which streamlines energy efficiency funding and accelerates California’s transportation electrification, is a step toward the $100 billion Hertzberg-Ting Joint Economic Stimulus Plan proposed in July…A $100 billion stimulus investment in advanced energy technologies can pay big dividends for California, according to from the Analysis Group for Advanced Energy Economy (AEE).
Investments in energy efficiency, renewable energy, and building and transportation electrification would add $727 billion to California’s economy, the study found. It would also create 4.1 million new jobs, increase tax revenues to local and state governments by $45.8 billion, and save consumers $28 billion in annual energy costs…The AEE report confirms that proposals for stimulus funding of advanced energy technologies are “the right track,” Assemblymember Ting said…
There are, though, “obvious and practical problems” with California’s clean energy goals, U.S. Secretary of Energy Dan Brouillette wrote in Sept. 25 editorial. Because of the variability of renewables and the limited duration of battery storage, “natural gas and nuclear must play a role.” Union of Concerned Scientists Senior Energy Analyst Mark Specht disagreed. California needs to “drastically reduce natural gas usage,” and Diablo Canyon, California’s one nuclear facility, is set for closure in 2025 under an approved settlement.
California’s electric sector includes an estimated 44% installed renewables capacity in 2020, according to the November 2019 California Public Utilities Commission report. That is far short of its 100% clean energy mandate and economy-wide zero emissions goal set for 2045…Stimulus funding can support the “massive investments” in California’s renewable generation and battery storage technologies needed to reliably achieve its 2045 goals, Specht said…Investing $100 billion in advanced energy technologies is a sound idea for economic stimulus because models show it will lead to “long-term economy wide savings,” Inclusive Economics Founder Betony Jones, a Clinton administration climate advisor, said… click here for more
posted by Herman K. Trabish @ 7:41 AM
0 comments
![]()
The 50 States of Electric Vehicles Report: All 50 States Took Electric Vehicle Actions During 2020
February 11, 2021 (North Carolina Clean Energy Technology Center [NCCETC])
“…[The NCCETC 2020 annual review and Q4 2020 update of The 50 States of Electric Vehicles found] all 50 states and DC took actions related to electric vehicles and charging infrastructure during 2020…[The greatest number of actions related] to rebate programs, followed by charging station deployment, rate design, electric vehicle registration fees, and studies…[Ten of the top electric vehicle trends of 2020 were] Utilities filing expansive transportation electrification plans; Growing use of the make-ready infrastructure model; State policymakers adopting bold electric vehicle targets; Utilities proposing passive and active managed charging programs; Utilities committing to electrify their own fleets…
…Encouraging charging infrastructure development at multi-family buildings; Utilities developing off-peak charging bill credit programs; States and utilities offering additional incentives for low-income customers; States preparing electric vehicle roadmaps and infrastructure plans; and Utilities filing residential charger leasing pilot proposals…A total of 598 electric vehicle actions were taken during 2020, with activity related to rate design, financial incentives, and deployment increasing over 2019…The top ten states taking the greatest number or most impactful actions in 2020 were New Jersey, California, New York, Minnesota, Colorado, Wisconsin, Connecticut, New Mexico, Oregon, and Hawaii…In Q4 2020, 43 states and DC took some type of action on electric vehicles and charging infrastructure. A total of 270 actions were tracked in Q4.” click here for more
posted by Herman K. Trabish @ 7:40 AM
0 comments
![]()
The 50 States of Solar: Q4 2020 & Annual Review
January 27, 2021 (North Carolina Clean Energy Technology Center)
Executive Summary
2020 SOLAR POLICY ACTION
State and utility solar policies continued to undergo review in 2020, with nearly every state in the country considering policy or rate design changes – a trend which has continued over the past several years and is likely to continue through 2021 and beyond. Table 1 provides a summary of state actions related to DG compensation, rate design, and solar ownership during 2020. Of the 257 actions identified, the most common were related to DG compensation policies (92), community solar policies (55), and residential fixed charge and minimum bill increases (48). The actions occurred across 46 states plus DC in 2020…
TOP TEN MOST ACTIVE STATES OF 2020
While nearly every state in the country took some type of action on distributed solar policy or rate design during 2020, some states were particularly active, taking many different actions or especially impactful actions. The following states stood out in 2020 for their solar policy activity:
1. Virginia Virginia lawmakers considered several bills related to net metering, community solar, and thirdparty ownership during the 2020 legislative session, enacting bills adopting a shared solar program, expanding third-party ownership options, increasing the net metering aggregate cap and system size limit, and establishing a plan for the development of a net metering successor tariff once the new aggregate cap is reached. 2. South Carolina Work continued in 2020 to develop a net metering successor tariff in South Carolina, pursuant to legislation enacted in 2019. In September 2020, Duke Energy announced an agreement it had reached on a tariff design with stakeholders, and in December, Dominion Energy filed its proposed tariff design. Both tariffs include time-varying credit rates, while Duke Energy’s also includes a minimum bill and Dominion’s includes a monthly subscription fee based on system capacity and an increased fixed charge.
3. Arkansas The Arkansas Public Service Commission issued a decision in June 2020 on a net metering successor tariff, maintaining retail rate net metering for the time being while authorizing a new grid charge (initially set at $0) for larger customer-generators. The Commission will allow utilities and other stakeholders to propose alternatives beginning in 2023. Regulators also worked to implement legislation authorizing solar leasing and service agreements, and decided to open a new proceeding to consider community solar.
4. Kentucky Kentucky Power, Kentucky Utilities, and Louisville Gas & Electric proposed net metering successor tariffs as part of their general rate case applications filed in 2020. All three utilities proposed net billing tariffs, with Kentucky Power’s using two daily netting periods and Kentucky Utilities and Louisville Gas & Electric’s tariffs using instantaneous netting. Each tariff uses avoided cost rate compensation for excess generation.
5. New York The New York Public Service Commission issued a decision in July 2020 establishing a net metering successor tariff for mass market projects interconnected after January 1, 2022. The tariff continues retail rate net metering with the addition of a monthly customer benefit contribution based on system capacity. The Commission also worked to establish a community benefit program for residential customers of municipalities that host major renewable energy facilities.
6. Connecticut Connecticut regulators worked toward the development of a net metering successor tariff during 2020. The Department of Energy and Environmental Protection and the Public Utilities Regulatory Authority filed a draft value of distributed energy resources study, and several parties filed joint comments on what the successor tariff structure should include. The Authority also considered issues related to the implementation of the state’s shared clean energy facility program.
7. California The California Public Utilities Commission opened a new proceeding in 2020 for the development of Net Metering 3.0 tariffs. The Commission released a draft study examining the costs to serve net metering customers in the state. Meanwhile, the Sacramento Municipal Utility District continued a stakeholder process to develop a net metering successor tariff and released a study examining the costs and benefits of net metering.
8. Idaho The Idaho Public Utilities Commission has been considering a number of net metering proposals from utilities. In 2020, the Commission approved Idaho Power’s proposal to make new large customer-generators subject to future net metering tariff changes. Regulators also approved a change to make new customer-generators in PacifiCorp’s territory subject to future net metering changes and directing the utility to conduct a study of on-site generation before tariff changes are considered.
9. Utah In Utah, the Public Service Commission issued a decision on Rocky Mountain Power’s proposed net billing tariff in October 2020, concluding a three-year process to develop export credit rates. In February 2020, Rocky Mountain Power filed its proposal, which included time-varying credit rates based on the avoided cost rate. The Commission approved higher export credit rates that vary seasonally, but not with time of day.
10. Michigan Michigan regulators approved net metering successor tariffs for Indiana Michigan Power and Consumers Energy in 2020. The Public Service Commission previously approved an inflowoutflow tariff structure, which is being implemented in individual utility rate cases. The Commission also directed the Commission Staff to conduct a value of distributed energy resources study, with a kick-off meeting happening in the first quarter of 2021.
TOP SOLAR POLICY TRENDS OF 2020
Utilities Proposing Additional Fees Based on System Capacity
For distributed generation (DG) rate design, attention has shifted dramatically from demand charges to charges based on a customer’s DG system capacity. The New York Public Service Commission approved a net metering successor tariff including a monthly customer benefit contribution based on DG system capacity. Both Evergy in Kansas and Dominion Energy in South Carolina proposed new fees based on DG system capacity during 2020.
States Adopting Unique Net Metering Successor Policies
States continue to operate as laboratories of innovation, adopting a wide array of net metering successor policy designs. In 2020, Arkansas and New York regulators opted to maintain retail rate net metering for at least certain customers and approve new monthly fees. The Utah Public Service Commission established net billing credit rates compensating customer-generators at a rate between retail and avoided cost for exported energy. Iowa lawmakers chose to move forward with a value of solar approach, with rate changes not occurring until at least 2027.
States Facing Challenges with Low-Income Community Solar Participation
Although the majority of state community solar policies include special provisions to encourage participation by low and moderate income customers, many states are still facing challenges in achieving this participation. In New Jersey, regulators are considering rule changes to streamline the income verification process, and in Oregon, the Commission delayed the requirement for community solar project managers to reach the state’s low-income subscription target.
Net Metering Successor Tariffs Being Considered on a Utility By Utility Basis
In several states, regulators are considering net metering successor tariff designs on a utility-byutility basis. In Kentucky, three utilities filed tariff design proposals in 2020 as part of general rate cases, and in Michigan, regulators approved DG tariffs for Indiana Michigan Power and Consumers Energy. In South Carolina, Duke Energy and Dominion Energy have both filed successor tariff proposals, which are significantly different. Arkansas regulators are allowing utilities to propose net metering alternatives beginning in 2023.
States and Utilities Considering Time-of-Use Crediting for Net Metering Customers
States and utilities are increasingly considering time-varying compensation for DG customers. In Utah, Rocky Mountain Power requested approval for time-varying credit rates for its net billing tariff, although the Commission did not approve the proposal. Both Duke Energy and Dominion Energy filed net metering successor tariff proposals that include time-varying crediting in South Carolina.
Utilities Continue to Propose Fewer and Smaller Residential Fixed Charge Increases
In 2020, utilities continued to propose significantly fewer residential fixed charge increases than in the last several years. Only 19 utilities proposed residential fixed charge increases, compared to 31 in 2019, 34 in 2018, 41 in 2017, and 47 in 2016. The increases being proposed are also smaller than in past years. The median increase proposed in 2020 was $2.47, compared to $3.00 in 2019, $3.87 in 2018, $4.00 in 2017, and $4.07 in 2016.
Interest Growing in Minimum Bills as a Distributed Generation Rate Design Element
Utilities and other parties are growing increasingly interested in minimum bills as a DG rate design element, particularly as an alternative to demand charges, capacity based charges, and fixed fees. In South Carolina, Duke Energy and solar stakeholders filed a net metering successor tariff proposal including a monthly minimum bill, while Virginia regulators authorized a minimum bill for shared solar customers. In Kansas, Evergy proposed a minimum bill as an alternative to a DG capacity-based charge.
States Considering Expansion of Existing Community Solar Programs
A number of states considered the expansion of existing community solar programs during 2020. In South Carolina, regulators reviewed existing community solar programs and directed utilities to make filings for new programs. In Virginia, lawmakers enacted bills establishing a shared solar program and a multi-family shared solar program, building on the state’s utility-led community solar program. New Jersey legislators also considered a bill making the state’s pilot community solar program a permanent program, with the Senate passing the bill during the year.
Strong Movement Away From Mandatory Residential Demand Charges
No investor-owned utility proposed a mandatory residential demand charge in 2019 or 2020, indicating strong movement away from demand charges as a rate design feature for residential DG customers. The Kansas Supreme Court also ruled in April 2020 that Evergy’s mandatory DG customer demand charge was in conflict with state law. Evergy was the only investor-owned utility with a mandatory DG customer demand charge in effect.
States Establishing Timelines for Net Metering Successor Transitions
Many states are setting specific dates or aggregate capacity thresholds for the consideration or implementation of net metering successor tariffs. Virginia lawmakers enacted a bill increasing the net metering aggregate cap and directing regulators to develop a net metering successor when a certain installed capacity threshold is reached. In Arkansas, regulators authorized utilities and other stakeholders to file net metering alternatives beginning in 2023, and Iowa legislators enacted a bill directing regulators to develop a value of solar methodology for future tariffs in 2027.
LOOKING BACK: 2015 – 2020
Despite the COVID-19 pandemic, distributed solar policy activity remained at a high level in 2020, with the total number of actions roughly on par with the last few years. States and utilities took a total of 257 actions in 2020, as compared to 265 actions in 2019, 264 actions in 2018, 249 actions in 2017, 212 actions in 2016, and 175 actions in 2015. Figure 4 shows the total number of solar policy actions taken in each year, by category, while Figure 5 displays the number of states taking action in each category. Note that several actions were considered over multiple years.
In 2020, distributed generation (DG) compensation, DG valuation, community solar, and thirdparty ownership activity increased, while actions related to residential fixed charge increases, demand and solar charges, and utility-led rooftop solar declined. The most dramatic change was in residential fixed charge actions, which decreased by 18% over 2019, continuing a strong trend of utilities proposing fewer of these fee increases.
The number of states taking solar policy actions decreased slightly in all categories except community solar. Overall, a total of 46 states and DC took actions considering changes to distributed solar policy and rate design during the year…
posted by Herman K. Trabish @ 7:35 AM
0 comments
![]()
It is nothing less than a sin and abomination that the U.S. has moved so slowly on this opportunity. Community solar gets solar to the majority of the population that does not have solar suitable roofs. From Reuters via YouTube
posted by Herman K. Trabish @ 7:41 AM
0 comments
![]()
This is a melodramatic telling of the facts, but that might rectify the under-reporting of the story at the time, a horror story that really happened. From KinoCheck International via YouTube
posted by Herman K. Trabish @ 7:41 AM
0 comments
![]()
How the race for renewable energy is reshaping global politics; As the transition from fossil fuels to clean energy gathers speed, what does it mean for the balance of power?
Leslie Hook and Henry Sanderson, February 3, 2021 (Financial Times)
“…Dozens of the world’s biggest economies have adopted targets for net-zero emissions of greenhouse gases by 2050. And 189 countries have joined the 2015 Paris climate accord, which aims to limit global warming to well below 2C…[A]s the energy system changes, so will energy politics. For most of the past century, geopolitical power was intimately connected to fossil fuels. The fear of an oil embargo or a gas shortage was enough to forge alliances or start wars, and access to oil deposits conferred great wealth. In the world of clean energy, [a new type of politics and] a new set of winners and losers will emerge…Countries or regions that master clean technology, export green energy or import less fossil fuel stand to gain from the new system, while those that rely on exporting… [18 months ago,] only 25 per cent of the world had a decarbonisation horizon. Today, 75 per cent of the world economy has a decarbonisation horizon…
The pace and scale of the transition to renewables have already shot past the most optimistic projections…[R]enewables will soon pass coal as the biggest source of power generation…[The transition will be painful for countries and] energy companies that produce oil and gas…For places such as Morocco, which imports more than 80 per cent of its energy but also has abundant solar resources, the transition could be an economic gift…[There are] three ways for countries to exert influence in the new system. One is by exporting electricity or green fuels. Another is by controlling the raw materials used in clean energy, such as lithium and cobalt. The third is by gaining an edge in technology, such as electric vehicle batteries…[With renewable resources so readily available, many expect] technology to be] the biggest differentiating factor… [And China is] racing far ahead of the rest…Chinese groups [are] ahead in almost every area of clean tech. China produces more than 70 per cent of all solar photovoltaic panels, half of the world’s electric vehicles and a third of its wind power. It is also the biggest battery producer and controls many of the raw materials crucial for clean-tech supply chains, such as cobalt, rare earth minerals and polysilicon…
Beijing embraced renewable energy manufacturing relatively early, focusing particularly on solar panels and LEDs. All this was supercharged in September 2020, when President Xi Jinping announced at the UN General Assembly that China would reach carbon neutrality by 2060… China is still the world’s biggest emitter of greenhouse gases and is heavily dependent on coal, which supplies 58 per cent of its electricity. But its companies are poised to benefit greatly, not only from the domestic energy transition, but from growing demand for clean-tech products around the world. As major economies work to reach their net-zero goals, they will have to buy more [of China’s] solar panels, batteries and critical minerals… The main supplier? China…[T]he US — which could see as much as $2tn invested in climate initiatives proposed by President Joe Biden — still has an edge in innovation… [Many other] countries are taking their own steps toward a clean energy future…
As the EU prepares for its target of net-zero emissions by 2050, some countries [like the UK and Norway, Portugal and the Netherlands, Germany and Morocco] are planning to trade more green fuels… [C]lean energy will involve a lot less geopolitics and might help reduce conflict…by ending the dependence on oil-producing countries… Levers of control in the clean energy system will still exist, but will never be as powerful as in the fossil-fuel world… [This could] lead to a more peaceful world, where international geopolitics in energy is less of a zero-sum game…During the next few years, as the energy transition gathers pace, the biggest resistance is likely to come from countries that produce fossil fuels. Even in the rosiest scenario, it will be decades before oil and gas are removed from the energy system… [But] what once looked impossible now seems inevitable…The energy transition will not only cut emissions: it will redistribute power.” click here for more
posted by Herman K. Trabish @ 6:50 AM
0 comments
![]()
FERC Opening Markets to Distributed Resources Not Cause for Celebration in California Yet
Herman K. Trabish, Sept. 29, 2020 (California Current)
Editor’s note: Integrating distributed renewables with utility-scale renewables is becoming an increasingly vital tool to balance variability.
Distributed resources advocates across the country celebrated the 2-1 vote approving Federal Energy Regulatory Commission Order 2222 for opening capacity, energy, and ancillary service markets to aggregated distributed energy.
They applauded FERC’s pomise to “usher in the electric grid of the future and promote competition in electric markets.”
The celebration may have been premature, especially in California, according to distributed energy resource aggregators and policy experts.
FERC cannot immediately impose rules that eliminate barriers to distributed energy aggregators participating in the California Independent System Operator and Regional Transmission Organization markets, Sunrun Director for Policy and Storage Market Strategy Chris Rauscher acknowledged. Sunrun, the leading U.S. solar-battery system installer, operates the first DER aggregation serving New England’s system.
Two important steps are necessary. According to Concentric Energy Advisors Senior Project Manager and former FERC economist Emma Nicholson, the first is meeting legal challenges to FERC’s jurisdictional authority over distribution utilities. That could set precedents for addressing “the ever-evolving and murky line between transmission and distribution,” she said.
The other step is coordination with distribution utilities and state regulators, delaying implementation “probably 2 years to 4 years away in some markets.”
Aggregators cheered Order 2222 because it “recognized current market rules have unaddressed, unreasonable barriers to full participation and full compensation of DER aggregations in wholesale markets,” Ted Ko, VP for Policy and Regulatory Affairs for Stem, an energy storage system software provider, said… click here for more
posted by Herman K. Trabish @ 8:36 AM
0 comments
![]()
NewEnergyNews has passed the 3.8 MILLION page views milestone!

------------------------
------------------------
------------------------
FEATURED BOOKS:
-------------------
NOTEWORTHY IN THE MEDIA:
NewEnergyNews would welcome any media-saavy volunteer who would like to re-develop this section of the page. Announcements and reviews of film, television, radio and music related to energy and environmental issues are welcome.
------------------------
------------------------
THE LAST TWO MONTHS
WEEKEND VIDEOS, June 24-25
WEEKEND VIDEOS, June 17-18
WEEKEND VIDEOS, June 10-11
WEEKEND VIDEOS, June 3-4
WEEKEND VIDEOS, May 27-28
WEEKEND VIDEOS, May 20-21
THINGS-TO-THINK-ABOUT WEDNESDAY, April 19:
THINGS-TO-THINK-ABOUT WEDNESDAY, April 12:
THINGS-TO-THINK-ABOUT WEDNESDAY, April 5:
THINGS-TO-THINK-ABOUT WEDNESDAY, March 29:
THINGS-TO-THINK-ABOUT WEDNESDAY, March 22:
THINGS-TO-THINK-ABOUT WEDNESDAY, March 2:
THINGS-TO-THINK-ABOUT WEDNESDAY, February 22:
FRIDAY WORLD, February 17:
THINGS-TO-THINK-ABOUT WEDNESDAY, February 15:
THINGS-TO-THINK-ABOUT WEDNESDAY, February 8:
THINGS-TO-THINK-ABOUT WEDNESDAY, February 1:
MONDAY STUDY AT NewEnergyNews, January 30:
THINGS-TO-THINK-ABOUT WEDNESDAY, January 18:
THINGS-TO-THINK-ABOUT WEDNESDAY, January 11:
THINGS-TO-THINK-ABOUT WEDNESDAY, January 4:
THINGS-TO-THINK-ABOUT WEDNESDAY, December 21:
THINGS-TO-THINK-ABOUT WEDNESDAY, December 14:
THINGS-TO-THINK-ABOUT WEDNESDAY, December 7:
THINGS-TO-THINK-ABOUT WEDNESDAY, November 30:
THINGS-TO-THINK-ABOUT WEDNESDAY, November 23:
Links
 Plug-in Hybrids, The Cars That Will Recharge America
 Oil On The Brain
Current Posts
Archives
*


 click to enlarge
 click to enlarge
 click to enlarge
 click to enlarge
 click to enlarge
 click to enlarge
 click to enlarge
 click to enlarge
 click to enlarge
 click to enlarge
 click to enlarge
 click to enlarge
 click to enlarge
 click to enlarge
 click to enlarge
 click to enlarge
 click to enlarge
 click to enlarge
 click to enlarge
 click to enlarge
 click to enlarge
 click to enlarge
 click to enlarge
 click to enlarge
 click to enlarge
 click to enlarge
 click to enlarge
 click to enlarge
 click to enlarge
 click to enlarge
 click to enlarge
 click to enlarge
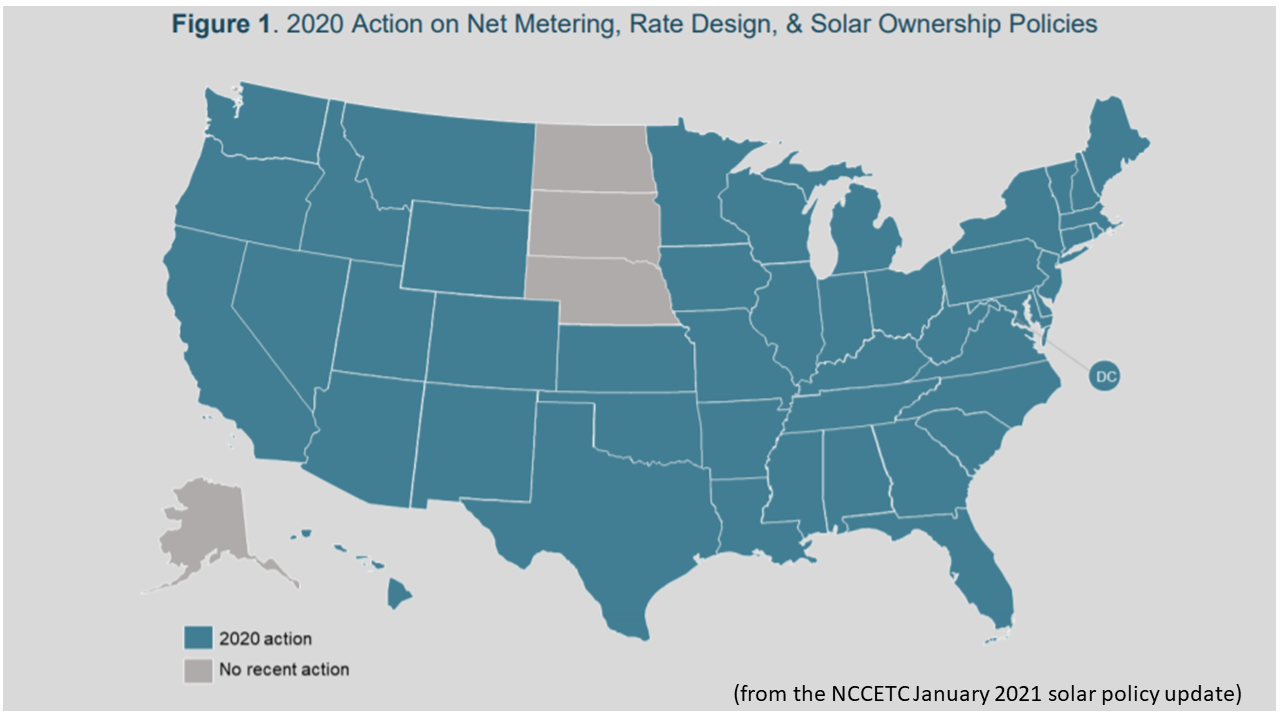 click to enlarge
 click to enlarge
 click to enlarge
 click to enlarge
 click to enlarge
 click to enlarge
 click to enlarge
 click to enlarge
 click to enlarge
 click to enlarge
 click to enlarge

