Have It All With The THRIVE Act
The huge jobs opportunity in New Energy makes an equitable economic recovery a real possibility. From NationalSierraClub via YouTube
posted by Herman K. Trabish @ 6:27 AM
0 comments
![]()
Gleanings from the web and the world, condensed for convenience, illustrated for enlightenment, arranged for impact...
The challenge now: To make every day Earth Day.

YESTERDAY
THINGS-TO-THINK-ABOUT WEDNESDAY, August 23:
THE DAY BEFORE
THE DAY BEFORE THE DAY BEFORE
WEEKEND VIDEOS, July 15-16:
THE DAY BEFORE THAT
WEEKEND VIDEOS, July 8-9:
THE LAST DAY UP HERE
WEEKEND VIDEOS, July 1-2:
--------------------------
--------------------------
Founding Editor Herman K. Trabish
--------------------------

--------------------------
WEEKEND VIDEOS, June 17-18
email: herman@NewEnergyNews.net
-------------------
-------------------
-------------------
Pay a visit to the HARRY BOYKOFF page at Basketball Reference, sponsored by NewEnergyNews and Oil In Their Blood.
The huge jobs opportunity in New Energy makes an equitable economic recovery a real possibility. From NationalSierraClub via YouTube
posted by Herman K. Trabish @ 6:27 AM
0 comments
![]()
If this battery technology proves in the marketplace that it meets its claim that it can match existing battery standards at one-tenth the price, it will cause an energy revolution. From Clearpath Action via YouTube
posted by Herman K. Trabish @ 6:26 AM
0 comments
![]()
Climate Change Is Driving Deadly Weather Disasters From Arizona To Mumbai
Rachel Treisman, July 29, 2021 (National Public Radio)
“…[Forecasts for] droughts, fires and hurricanes are looking downright bleak…But how exactly is global warming driving dangerous weather? …[T]his past June was the hottest June recorded in the U.S. in more than a century, about four degrees hotter on average…There's been about two degrees Fahrenheit of warming so far worldwide…[D]angerous thresholds of high temperature and high humidity] could potentially happen twice as often as they have in the past…[W]hen wildfires do happen, they burn hotter and even create their own weather systems in which huge pyrocumulus clouds can generate lightning strike — in turn causing even more fires…
…[Flash flood disasters from Central China to western Europe to Mumbai to Arizona] have killed hundreds of people, but they're not a surprise to climate scientists…[T]heir root cause was the same: extreme rain. And it's getting more common as the Earth gets warmer (hot air + hot water = more moisture in the air)…Plus, as the planet heats up, some climate models show winds in the upper atmosphere slowing down in certain places, which would mean that extreme weather would linger there longer…Scientists are working hard to predict how common these disasters will be in the years to come…” click here for more
posted by Herman K. Trabish @ 8:21 AM
0 comments
![]()
Renewables jobs 'to grow fivefold globally by 2050' as fossil-fuel industry shrinks: study; Employment boom in wind and solar sectors will far outweigh job losses in oil, gas and coal industries, say researchers
Josh Lewis and Leigh Collins, 26 July 2021 (RECHARGE)
“Global renewable energy jobs will grow fivefold from 4.4 million today to 22 million by 2050, with more than 85% of those gains in the wind and solar sectors…Jobs in the fossil-fuel sector will, at the same time, fall from 12.6 million to 3.1 million, with about 80% of the job losses related to oil, gas and coal extraction…Overall, the number of jobs in the energy industry will grow from 18 million today to 26 million in 2050 — with 84% of those in renewables, 11% in fossil fuels and 5% in nuclear — under the report's “well-below 2°C” (WB2C) scenario…
…Regions likely to benefit from the energy transition include Southeast and South Asia, the Middle East and North Africa, Indonesia, the US, Brazil, India, Japan and South Korea…” click here for more
posted by Herman K. Trabish @ 8:20 AM
0 comments
![]()
As Biden targets 100% clean electricity, strategies emerge to reliably integrate rising renewables; System controls, flexibility through DER, and new policies supporting market economics are coming
Herman K. Trabish, April 19, 2021 (Utility Dive)
Editor’s note: Power system operators everywhere continue to work toward greater reliability are resources and load become more dynamic.
In the transitioning power system, barriers are falling between renewables and traditional fossil and nuclear generation and between types of variable generation like wind and solar. The energy infrastructure proposals from the Biden administration, if approved by Congress, are likely to accelerate that.
In response to the rising penetrations of variable utility-scale wind and solar, as detailed by a December 2020 data compilation from Department of Energy (DOE) researchers, and reliance on less cost-competitive natural gas fades, new solutions already in the works will assure reliability, power system analysts said.
Combined, utility-scale wind and utility-scale solar were "58% of all new U.S. generation capacity over the past six years," said Research Scientist Mark Bolinger of DOE’s Lawrence Berkeley National Laboratory (LBNL). LBNL's presentation of where the two resources have reached or can reach higher penetrations shows regulators and utilities how to plan "more-realistic portfolios" for their regions to meet Biden administration goals, Bolinger said.
The LBNL data reflects a transition "to an era where we need to assemble portfolios of resources into tradable energy products" that can be dispatched as predictably as traditional generation, Energy Innovation Senior Fellow Eric Gimon said. "There may not be one perfect way to bring this portfolio concept into markets, but we need to learn how to do it" to make clean energy viable and reliable in the energy marketplace.
Regulators, system operators, utilities and the private sector are starting to develop ways to reliably integrate the rising penetrations of variable renewables with flexible distributed energy resources (DER) to increase reliability, Bolinger and Gimon agreed. But the smart 21st century transmission and distribution (T&D) system and policy strategies the new power system will need to optimize this resource transformation are still in the works, stakeholders said.
There is a growing recognition of the falling costs of renewables and storage shown in the LBNL data that favor the transition to a new power system. The Biden administration’s focus on climate is likely to drive even more clean power integration because renewables are winning the market, according to a July 2020 report from the American Council on Renewable Energy (ACORE).
"President Biden has talked about transformation in a way we have not heard from presidents before," ACORE President and CEO Gregory Wetstone said. For that, "power system infrastructure must change because renewables and emissions-reduction mandates are increasing, renewables and storage technologies are becoming more cost-competitive, and business and residential customer demand are accelerating that need." The cost-competitiveness of utility-scale solar-plus-storage projects shown in LBNL's data was confirmed by a November 2020 BlooombergNEF report. Solar-plus-storage projects are now "a viable, dispatchable clean energy resource for utilities," BloombergNEF said… click here for more
posted by Herman K. Trabish @ 6:50 AM
0 comments
![]()
The 50 States of Solar: States Consider Time-Varying Rates and Battery Storage in Net Metering Tariff Design in Q2 2021
July 21, 2021 (North Carolina Clean Energy Technology Center [NCCETC])
“…[NCCETC’s Q2 2021 50 States of Solar finds that 42 states, plus the District of Columbia, took some type of distributed solar policy action during Q2 2021…[The greatest number of actions continued] to address net metering policies (60), community solar policies (38), and residential fixed charge or minimum bill increases (30). A total of 179 distributed solar policy actions were taken during Q2 2021…[Three trends in solar policy activity taken in Q2 2021 were]: (1) regulators evaluating time-varying credit rates for net metering customers, (2) utilities designing distributed generation programs with energy storage in mind, and (3) states continuing to focus on community solar for low-income customers…
The top five distributed solar policy actions of Q2 2021 [were]…South Carolina regulators approving solar choice metering tariff designs…The Kentucky Public Service Commission issuing a decision on Kentucky Power’s net metering proposal…Hawaii’s HECO utilities proposing new distributed energy resource programs…Sacramento Municipal Utility District proposing a net metering successor tariff in California…[and] Pedernales Electric Cooperative in Texas considering major net metering changes…” click here for more
posted by Herman K. Trabish @ 6:49 AM
0 comments
![]()
GLOBAL WIND REPORT 2021
March 2021 (Global Wind Energy Council)
2020 – A Record Year For The Wind Industry
2020 was the best year in history for the global wind industry showing year-over-year (YoY) growth of 53%. Installing more than 93 GW wind power in a challenging year with disruption to both the global supply chain and project construction has demonstrated the incredible resilience of the wind industry.
Market status
The 93 GW of new installations brings global cumulative wind power capacity up to 743 GW. In the onshore market, 86.9 GW was installed, an increase of 59% compared to 2019. China and the US remained the world’s largest markets for new onshore additions, and the world’s two major economies together increased their market share by 15% to 76%, driven by the Feed-in Tariff (FiT) cut-off in China and the scheduled phase-out of the full-rate Production Tax Credit (PTC) in the US, respectively.
On the regional level, 2020 was also record year for onshore installations in Asia Pacific, North America and Latin America. The three regions combined installed a total of 74 GW of new onshore wind capacity last year, or 76% more than the previous year. Due to the slow recovery of onshore installations in Germany last year, Europe saw only a 0.6% YoY growth in new onshore wind installations. Developing markets in Africa and the Middle East reported 8.2 GW onshore installations last year, almost the same as in 2019.
In the offshore market, 6.1 GW was commissioned worldwide last year, making 2020 the second-best year ever. China installed half of all new global offshore wind capacity in a record year. Steady growth was recorded in Europe with the Netherlands taking the lead followed by Belgium, the UK, Germany and Portugal. The remaining new offshore wind installations in 2020 were shared by the US and South Korea. Total offshore wind capacity has now passed 35 GW, representing 4.8% of total global cumulative wind capacity.
Market dynamics
While the first half of 2020 saw auctions being postponed or cancelled due to COVID-19, the sector bounced back with vigour in the second half of the year as key mature and emerging wind markets began to overcome the impacts of the pandemic. According to GWEC Market Intelligence, nearly 30 GW of new wind power capacity was awarded globally through auctions in the second half of 2020, which is a slight increase compared to the 28 GW awarded during H2 2019. Although only 1 GW offshore wind capacity was awarded through auctions worldwide, more than 7 GW of offshore wind auctions/ tenders were launched in 2020. This surge in new capacity to be auctioned is a clear signal that the industry is back on track and that the global pipeline of wind power projects continues to grow.
Through technology innovations and economies of scale, 2020 saw wind power continue to build its competitive advantage throughout the world. Last summer, a consortium of Shell and Eneco won the third zero-subsidy offshore wind tender in the Netherlands. In Latin America, as wind power already had very competitive prices, private auctions or bilateral PPAs have already emerged as an alternative mechanism to government auctions to drive growth. According to BloombergNEF, 6.5 GW wind power was signed through corporate PPAs globally last year, 29% lower than the previous year. Considering the fact that COVID-19 disruptions across the world have caused revenues to plummet for many corporates, the level of commitment to sustainable green energy remains impressive.
Last year also witnessed governments of countries such as China, Japan and South Korea making net zero/carbon neutrality commitments, and similar commitments were also made by major corporates including oil and gas companies. To reach the net zero targets, completing a systematic and radical energy transition from fossil fuels to renewable energy and low-carbon solutions is imperative. The current crisis offers a unique window of opportunity to put the world on a sustainable trajectory and meet our international climate goals, but we must act now - or miss the opportunity. Although reaching net zero will require bold actions by a large number of sectors and actors, wind power is placed to be one of the cornerstones of green recovery and to play an important role in accelerating the global energy transition.
Market Outlook
After an unusual 2020, global wind market growth is likely to slow down in the near-term primarily due to an expected drop in onshore installations in China and the US following the expiry of incentive schemes. Nevertheless, the market outlook for our forecast period remains positive. GWEC Market Intelligence expects that over 469 GW of new onshore and offshore wind capacity will be added in the next five years - that is nearly 94 GW of new installations annually until 2025, based on present policies and pipelines. We hope and expect that governments will significantly increase their ambitions and targets following COP26, and for that reason we are upwardly revising our forecasts for the GWR2022. The CAGR for onshore wind in the next five years is 0.3% and GWEC expects annual installation of 79.8 GW. In total, 399 GW is likely to be built in 2021-2025.
The CAGR for offshore wind in the next five years is 31.5%. The level of annual installations is likely to quadruple by 2025 from 6.1 GW in 2020, bringing offshore’s market share in global new installations from today’s 6.5% to 21% by 2025. In total, more than 70 GW offshore is expected to be added worldwide in 2021-2025.
Wind energy’s role on the road to net zero…Enabling technology: Power-to-X and green hydrogen…Markets to Watch…
Market status 2020…
Overview
2020 saw global new wind power installations surpass 90 GW, a 53% growth compared to 2019, bringing total installed capacity to 743 GW, a growth of 14% compared to last year. New installations in the onshore wind market reached 86.9 GW, while the offshore wind market reached 6.1 GW, making 2020 the highest and the second highest year in history for new wind installations for both onshore and offshore. Thanks to the explosive growth of installations in China, Asia Pacific continues to take the lead in global wind power development with its share of the global market increasing by 8.5% last year. Driven by a record year of installations in the US, North America (18.4%) replaced Europe (15.9%) as the second largest regional market for new installations. Latin America remains the fourth largest regional market (5.0%) in 2020, followed by Africa & Middle East (0.9%). The world’s top five markets in 2020 for new installations were China, the US, Brazil, Netherlands and Germany. These five markets combined made up 80.6% of global installations last year, collectively more than 10% greater than 2019. In terms of cumulative installations, the top five markets as of the end of 2020 remained unchanged. Those markets are: China, the US, Germany, India and Spain, which together accounted for 73% of the world’s total wind power installations…
Market outlook 2021-2025
Global wind energy market expected to grow on average by 4 per cent each year
GWEC’s Market Outlook represents the industry perspective for expected installations of new capacity for the next five years. The outlook is based on input from regional wind associations, government targets, available project information and input from industry experts and GWEC members. An update will be released in Q3 2021. A detailed data sheet is available in the member only area of the GWEC Intelligence website.
Global outlook
The market outlook for the global wind industry remains positive. The CAGR for the next five years is 4.0%, even though the installed capacity for 2020 marked a new high. l
GWEC Market Intelligence expects that over 469 GW of new capacity will be added in the next five years. That is nearly 94 GW of new installations each year until 2025.
Growth at the beginning of the next five-years will continue to be driven by government policy, including FiT, PTC, ITC, Green Certificates and renewable or technology-neutral auctions and tenders. New installations are expected to drop slightly in 2021, but it is still possible to make it the second-best year in history, taking into account the ongoing installation rush in the world’s two largest markets, China (offshore) and the US (onshore), driven by the cut-off of FiT and the deadline to qualify the full PTC value respectively.
From 2022 onward, although the PTC will remain as the main driver for installations in the US (where the one extra year PTC extension passed the senate last December can prevent the US onshore market from a cliff drop in 2025), the rest of world is expected to operate based on wind-only, hybrid, and technology-neutral auctions or on the grid-parity scheme (mainly China). To ensure stable growth in Europe, Latin America, Africa & Middle East and South East Asia, lessons shall be learnt from the previous auction market design failures in countries like Germany and India.
Global onshore outlook
The CAGR for onshore wind in the next five year is 0.3%. The average annual installation is 79.8 GW. In total, 399 GW is likely to be built in 2021-2025. In China, from 2021, onshore wind has entered a new era: subsidy-free. Although the expected drop in the Chinese onshore market in the near-term will slow down global onshore growth, the net zero targets declared by the Chinese government and the implementation plans of provincial governments and corporates are likely to accelerate the new installations from 2022(for details, see the China net zero case study).
Global offshore outlook
The CAGR for offshore wind in the next five year is 31.5%. New installations are likely to quadruple by 2025 from 6.1 GW in 2020. In total, more than 70 GW offshore is expected to be added worldwide in 2021-2025. This positive global offshore wind market outlook is supported by: 1) the sharp drop of offshore wind LCOE, 2) increased offshore wind targets in Europe, the United States and key markets in Asia such as Japan and South Korea, 3) the expected commercialisation and industrialisation of floating wind, and 4) offshore wind’s unique role in facilitating cross industry cooperation and accelerating the global energy transition from fossil fuel to renewables..,
posted by Herman K. Trabish @ 7:16 AM
0 comments
![]()
Blame the weird and terrifying weather on the supernatural deities? No, blame people. The good news: What people do, they can undo. From The Late Show with Stephen Colbert via YouTube
posted by Herman K. Trabish @ 7:47 AM
0 comments
![]()
Action addressing the changing climate has been inadequate. It’s that simple. Now the challenge is daunting and global. It is past time to get busy. No more excuses. From MSNBC via YouTube
posted by Herman K. Trabish @ 7:45 AM
0 comments
![]()
The challenge is the extremely high temperatures needed for industrial processes 24/7; the solution is a magnifying lens for concentrated solar and efficient storage strategies. From Big Think via YouTube
posted by Herman K. Trabish @ 7:43 AM
0 comments
![]()
Politicians from across world call for ‘global green deal’ to tackle climate crisis; New alliance urges governments to work together to deliver a just transition to a green economy
Fiona Harvey, 18 July 2021 (UK Guardian)
“…The Global Alliance for a Green New Deal is inviting politicians from legislatures in all countries to work together on policies that would deliver a just transition to a green economy ahead of Cop26 UN climate talks in Glasgow this November…[The alliance includes the UK, Brazil, Argentina, Indonesia, Malaysia and the US among other countries…
…[There are already] wildfires raging across the west coast [of the US], extreme hurricanes, heatwaves in Australia, massive flooding around the world…The alliance wants governments to put measures in place that would boost the green economy…Many government leaders have promised to “build back better”… but few countries are investing in the new infrastructure needed…[and] more than $3tn was being poured into measures and industries that actively harmed the environment, such as coal and other fossil fuels…
As the consequences of the climate crisis become more and more alarming, inequalities are growing and the poorest are hit hardest by the impacts of a changing climate. If we want fair, systematic and effective climate policies, we need a radical shift…[according to the alliance, which] currently has 21 members from 19 countries…” click here for more
posted by Herman K. Trabish @ 7:39 AM
0 comments
![]()
The World Has Achieved Huge Milestones in 6 Areas of Renewable Energy So Far This Year
Andy Corbley, July 1, 2021 (Good News Network)
…[M]arket demand and private entrepreneurship is driving what can only be described as a revolution in renewable energy…[The] latest achievements might have been thought unbelievable when global climate change was first being discussed as a serious threat…[S]ix months into 2021, we have already seen some amazing progress in wind, solar, and EVs…Citizens from the [Democratic Republic of the Congo, Sengal, and Nigeria face low] rates of reliable electricity…[but] solar power plants are set to help this problem…
…[For wind manufacturers and investors,] 2021 was the single best year on record…[According to the 2021 Global Wind Report the global industry added 93 gigawatts,] equaling a 53% increase since 2020…Through technology innovations and economies of scale, the global wind power market has nearly quadrupled in size over the past decade and established itself as one of the most cost-competitive and resilient power sources across the world…
…[And] 74,000 of the 373,900 cars that left German assembly lines were either electric or hybrid vehicles…Germany is the fourth largest auto market in the world, and electric car registrations—that’s bought and driven EVs—grew from a 4% national market share in December 2019, to a whopping 26% market share just 12 months later. 24% of these EVs were made by Volkswagen…Hybrids also jumped from 3% to 13%, meaning that there are more hybrids and EVs on German roads than gasoline-powered cars…[Globally, EV purchasing climbed 40% during 2020… click here for more
posted by Herman K. Trabish @ 7:39 AM
0 comments
![]()
Amid rising rooftop solar battles, emerging net metering alternatives could shake up the sector; A “holistic product bundle” of DER could offer not "just a transition" but "a just transition,” tariff analysts say.
Herman K. Trabish, March 18, 2021 (Utility Dive)
Editor’s note: Stakeholders say this debate will be decided in California this year.
The costs to non-solar owning customers of net energy metering (NEM) policies that support rising levels of rooftop solar in more than 29 states have created division between utilities and DER advocates, but elements of a new policy that can balance the cost shift with system benefits for all customers are emerging, power system analysts say.
Distributed solar owners in many states pay only for the net kilowatt-hours on their meters after compensation for exported solar-generated kilowatt-hours is deducted at the retail electricity rate. This NEM policy does not significantly shift system costs to other customers at low solar penetrations, but the accelerating growth of distributed energy resources (DER) is creating growing concerns about a cost shift from customers who own solar to those who don't.
NEM "is a useful tool, but it's just a tool," Edison Electric Institute (EEI) General Counsel and Senior Vice President for Clean Energy Emily Fisher told a Feb. 9 National Association of Regulatory Utility Commissioners (NARUC) Winter Summit audience during one of three panels on NEM. "There are ways to reform it to allow even greater benefits from DER and still avoid imposing a cost shift."
DER advocates at the conference agreed
Discussions about an NEM successor tariff to sustain DER growth has, until recently, led only to controversy. But NARUC summit presentations suggested there may be some emerging consensus on policy elements like adding incentives for storage. And a new South Carolina proposal involving Duke Energy offers a "holistic product bundle" that could lead to "new possibilities," according to summit panelists.
An NEM successor tariff becomes important when DER penetrations of over 5% of system peak load threaten to impose significant costs for system infrastructure on non-solar owning customers, "and more states are moving toward that level," said North Carolina Clean Energy Technology Center (NCCETC) Senior Policy Program Director Autumn Proudlove. Legislative and regulatory policy actions on distributed solar steadily increased from 2015 to 2020, Proudlove told the NARUC summit. In 2020, DER compensation was the focus of 92 actions in D.C. and 34 states, up from just 41 actions in 26 states in 2015… click here for more
posted by Herman K. Trabish @ 9:07 AM
0 comments
![]()
More Power Lines or Rooftop Solar Panels: The Fight Over Energy’s Future; The choices that lawmakers, energy businesses and individuals make in the next few years could lock in an energy system that lasts for decades.
Ivan Penn and Clifford Krauss, July 12, 2021 (NY Times)
“The nation is facing once-in-a-generation choices about how energy ought to be delivered…On one side, large electric utilities and President Joe Biden want to build thousands of miles of power lines to move electricity created by distant wind turbines and solar farms to cities and suburbs…On the other, some environmental organizations and community groups are pushing for greater investment in rooftop solar panels, batteries and local wind turbines…[The intense policy struggle] could lock in an energy system that lasts for decades…
Most energy experts agree that the United States must improve its aging electric grids…[to] replace coal and natural gas power plants with large wind and solar farms hundreds of miles from cities…[Opponents] argue that solar panels, batteries and other local energy sources should be emphasized because they would be more resilient and could be built more quickly…
…[The Biden] administration supports rooftop solar and microgrids, but believes] decentralized approaches would not be sufficient to achieve the president’s goal of eliminating greenhouse gas emissions from the power sector by 2035…[The response by rooftop solar and storage during the August 2020 outages showed they] can become mini power plants, potentially earning as much from supplying energy as they pay for electricity they draw from the grid…
But the utility industry argues that new transmission lines are needed to get to 100% clean energy and power electric cars and trucks. Those high costs will be offset by the money saved from switching from fossil fuels to cheaper solar panels and wind turbines…Many Americans resist transmission lines for aesthetic and environmental reasons… click here for more
posted by Herman K. Trabish @ 9:05 AM
0 comments
![]()
Who Will Pay for Legacy Utility Costs?
Lucas Davis and Catherine Hausman, July 6, 2021 (Energy Institute at Haas/ University of California, Berkeley)
Growing and Shrinking Utilities
The current push for building electrification is still in its early stages, so it is too soon for an empirical analysis of how utility behavior responds to this policy push. Instead, we use historical evidence from growing and shrinking utilities as a proxy. Although mostly driven by population change, not building electrification, this evidence is a valuable opportunity to learn what happens when large numbers of customers enter and exit.
The figure below shows residential customer counts for a random set of U.S. natural gas distribution utilities during the period 1997-2019. The utility business is often thought of as stable and predictable, but we show that utilities have experienced a surprisingly large amount of recent change. We observe, for example, 320 utilities that experienced five or more consecutive years of customer growth, and 250 utilities that experienced five or more consecutive years of customer loss.
The shrinking utilities may seem surprising. But even though the total number of U.S. natural gas customers has increased 25% over this time period, many specific regions have lost population. Many utilities have lost customers, especially in rural areas, parts of the Southeast, Rust Belt, and Appalachia. Customer loss is particularly pronounced for small municipal utilities, but we also see it in cities like Philadelphia, PA and Birmingham, AL.
Utility Operations
In the paper we use evidence from these growing and shrinking utilities to understand how utility operations and finances change with customer entry and exit. The single largest asset for these utilities is the pipeline infrastructure. Accordingly, we compile data on the total number of pipeline miles operated by each utility, and we examine how this responds to changes in the customer base.
As the figure below illustrates, we find that when utilities are growing, they add pipelines. A 10% increase in the number of residential customers on average leads to a 4% increase in pipeline miles. However, when utilities are shrinking, they do not remove pipelines. A 10% decrease in the number of residential customers has a precisely estimated 0% effect on pipeline miles.
Thus, utilities *expand* the distribution network during years of customer growth, but rarely *shrink* the network during years of customer loss. This makes sense. When a gas utility loses a customer, it generally doesn’t retire gas mains because other customers are still on that pipeline.
Utility Finances
We next perform a similar analysis using data on utility revenues. Utilities collect revenue from customers to pay for capital and operating costs, and we want to understand how these revenues respond to changes in the customer base. Part of our motivation for the paper is that many categories of utility expenditures are likely to be “legacy costs” that don’t necessarily disappear as customers leave the system.
This is exactly what we find. Similar to the pattern for pipeline miles, we find an asymmetric relationship between utility revenue and the size of the customer base. A 10% increase in residential customers leads to 10% increase in revenues. However, a 10% decrease in customers leads to only a 5% decrease in revenues. This pattern implies that some costs do stick around after customer exit and that remaining customers make up half the lost revenue through increased rates.
This same dynamic is likely to play out in response to increased building electrification. During such a transition, it won’t be easy to retire pipelines until everyone in the network has discontinued service. Moreover, in addition to maintaining pipelines, the utility will still need to pay for legacy costs including past capital expenditures, pensions, and ongoing operations and maintenance.
Cost Shift
Finally, we use our empirical estimates to simulate future bill impacts for different levels of building electrification.
Recent studies assume roughly a 15% reduction in natural gas residential customers by 2030; 40% by 2040; and 90% reduction by 2050. Our estimates imply that customer losses of this magnitude would mean annual bill increases of $30, $120, and $1,600 per remaining residential customer, respectively.
The figure below summarizes our results. The cost shift starts out modest but then increases sharply as legacy costs become concentrated on an increasingly small number of remaining customers.
Did Somebody Say Utility Death Spiral?
Higher retail prices for natural gas will also accelerate the transition away from natural gas, prompting further customer exits, and thus additional price increases. While these dynamics will not last forever, an energy transition of this magnitude affects a large number of U.S. households and businesses, so it is critical to trace out the implications for both efficiency and equity. Figuring out the right set of policies to provide a path for decarbonization without hurting low-income households or pipeline safety will be challenging, and our paper provides some suggestions for policymakers.
We also see similarities between natural gas and electricity. There is a similar dynamic with electricity in that rooftop solar lowers utility revenues and can push fixed cost recovery onto low-income customers. However, buildings with rooftop solar generally don’t completely leave the grid. The mechanism in natural gas is different — customers depart entirely. Thus the standard rate reforms that are frequently suggested for rooftop solar, which assume that customers stay connected, would not address the fixed cost recovery and equity issues that arise with natural gas.
Fundamentally, cost recovery and natural gas utility operations and investment will need to be rethought so that the electrify everything movement is equitable.
posted by Herman K. Trabish @ 6:48 AM
0 comments
![]()
DOE’s new software tool could be solar’s first red tape cost-cutting breakthrough. From U.S. Department of Energy via YouTube
posted by Herman K. Trabish @ 7:40 AM
0 comments
![]()
New Energy now offers West Virginia a viable choice for a just transition away from its coal addiction. From WOWK 13 News via YouTube
posted by Herman K. Trabish @ 7:40 AM
0 comments
![]()
CO2 levels are up in the Amazon rainforest, suggesting its capability to protect the climate by absorbing greenhouse gases has been expended. From CBS News via YouTube
posted by Herman K. Trabish @ 7:39 AM
0 comments
![]()
Big Oil’s lies about climate change—a climate scientist’s take
Adam Sobel, July 9, 2021 (Bulletin of the Atomic Scientists)
“…[Calling fossil fuel companies’ culpability for the climate crisis crime might seem] too extreme…[because] Exxon and the others were just working within our legal, economic, and political systems to provide a commodity we all use every day. They may have known that global warming posed a risk, but people accept all kinds of risks in exchange for the many benefits of living a relatively affluent life in a modern, industrialized economy…It comes down to the scale of the harm; the willful, systematic, and sustained nature of the lying; and the leading role the climate denial movement has played in the sustained assault on democracy…
…[T]he legal system so far seems ill-equipped to grasp it...But the moral case, at least, is clear…We know now that fossil fuel company researchers understood early on, from their own work as well as that of academic and government researchers, that warming due to human emissions of greenhouse gases posed risks at the planetary scale…[It is almost certain that economists, and consequently also politicians,] have historically grossly underestimated the sheer scale of the harm, because economics as a discipline is based on assumptions that don’t fit global-scale environmental crises…
…[Fossil fuel executives] could argue that they have worked within the legal system…[and fulfilled] their fiduciary duty to maximize shareholder value…[But they] have systematically, cynically misrepresented and suppressed the facts. Their jobs didn’t require them to do this…[and it] is well documented and widely known…And they’re still doing it: perhaps not all of them, and perhaps in some cases with different tactics, but fossil fuel companies are still funding denial groups and politicians who act on the denial agenda…Having learned that propaganda can make a decent fraction of the population believe lies on a large scale with no consequence, it’s hard for these bad actors not to keep doing it…” click here for more
posted by Herman K. Trabish @ 7:41 AM
0 comments
![]()
Highlights From The BP Statistical Review Of World Energy 2021
Robert Rapier, July 11, 2021 (Forbes)
“…[Typically comprehensive summary of energy trends, disruptions by COVID make the BP Statistical Review of World Energy 2021 less indicative] of these trends…[Oil demand fell dramatically last year, but] has largely recovered…Primary global energy consumption fell by 4.5% last year, which was the largest annual decline since 1945. About three-fourths of the decline came from oil…Small declines were also reported in coal, natural gas, and nuclear consumption, while renewables and hydropower recorded gains…[Oil still had] a 31.2% share of all energy consumption…[followed by] coal (27.2%), natural gas (24.7%), hydropower (6.9%), renewables (5.7%), and nuclear power (4.3%)…
…[Fossil fuels] accounted for 83.1% of the world’s primary energy consumption in 2020…There were consumption declines in over 95% of the countries, and] the U.S., India, and Russia contributed the largest annual declines…China was one of the rare exceptions, growing energy consumption by 2.1% over 2019. Still, that was well below China’s 3.8% average growth over the previous 10 years…Global carbon dioxide emissions fell by 6.3% in 2020…[This was] the largest decline since 1945… Despite the massive decline in global energy demand, global renewable energy consumption grew by 10% in 2020…
…Solar capacity increased by 127 gigawatts (GW), while wind capacity grew 111 GW. The growth in wind capacity was nearly double the highest prior annual increase. Together, wind and solar power now have a global capacity of 1,441 GW…[In 2010, it was 221 GW…China was the largest individual contributor…Nuclear consumption fell in 2020 by 4.1%...[I]t's more than obvious that the growth story for wind and solar power has many years to run. This will be especially true if the world continues to electrify its transport systems as expected…” click here for more
posted by Herman K. Trabish @ 7:41 AM
0 comments
![]()
CPUC and Stakeholders Strive to Stop Spiking Rates
Herman K. Trabish, March 9, 2021 (California Current)
Editor’s note: Electricity might seem expensive but live without it for a couple of days and see what value it has.
California will not let its skyrocketing electricity rates threaten reliability or its policy goals, California Public Utilities Commission President Marybel Batjer told stakeholders during a Feb. 24 full commission hearing.
The costs of California’s policy mandates are driving rates up faster than inflation and straining the budgets of customers made more vulnerable by the recession, stakeholders and CPUC Staff agreed during the day-long session. Additionally, the costs of Net Energy Metering and other distributed energy resources incentives are taxing the budgets of vulnerable customers, making new approaches to affordability urgent.
Protecting ratepayers “will require aggressive actions,” CPUC Staff’s “Evaluation of Electric Costs, Rates and Equity Issues” reported. Utilities proposed ways to cut wildfire costs and raise revenues outside rates. Stakeholders proposed ways to financially support distributed energy resources and electric vehicle growth. Breakthrough rate designs could ease the burden of rising costs on low and moderate income customers.
Residential energy costs and rates began rising faster than inflation in 2013 and bills continue to grow annually, staff reported. By 2030, residential rates for PG&E will be 40% higher than if they had risen at the rate of inflation from 2013. SCE rates would be 20% higher and SDG&E rates would be 70% higher.
Distributed energy and EVs can reduce customers’ utility bills but up-front costs are a barrier to low income customer participation, staff found. The middle class may soon need help because “rates are growing so much faster than wages,” Jennifer Dowdell, a senior energy expert with The Utility Reform Network, warned.
Wildfire mitigation costs, transmission development costs, rising transmission use charges, and the state’s increasingly ambitious emissions reduction goals drive up rates. Another growing factor is the cost of the state-mandated Net Energy Metering 2.0 program compensating customers for electricity their distributed resources send to utilities. Net metered generation exceeded the private utilities’ residential electricity consumption in 2019, recent research showed… click here for more
posted by Herman K. Trabish @ 8:06 AM
0 comments
![]()
Estimated Climate Benefits Of Clean Energy Standars Are Large, Outweigh Costs
July 12, 2021 (Clean Energy Futures Project)
“…[An illustrative 80×30 clean electricity standard (CES)] shows that achieving the Biden Administration’s clean electricity goal through a CES would have modest costs and large benefits…[and if congress shifts costs] to the federal government,] electricity rates would likely fall…[The illustrative 80×30 CES has the largest total benefits, climate-related net benefits, and health benefits of eight policies examined.
The present value of the estimated climate benefits through 2050 ($637 billion) outweigh the estimated costs ($342 billion)…[It would] generate estimated present value health benefits of $1.13 trillion due to cleaner air, bringing the estimated present value net benefits to $1.43 trillion for 2020 to 2050…compared to a no-policy reference case…” click here for more
posted by Herman K. Trabish @ 7:52 AM
0 comments
![]()
Solar and wind grid system value in the United States: The effect of transmission congestion, generation profiles, and curtailment
Dev Millstein, Ryan Wiser, Andrew D. Mills, Mark Bolinger, Joachim Seel, Seongeun Jeong, July 21, 2021 (Joule)
Summary
The value of electricity generated from wind and solar sources declines as supply increases. This decline in value has varied over time and across regions, indicating that strategies to mitigate value decline will need to be carefully targeted. To help guide development of these strategies, we empirically determine wind and solar value at 2,100 plants within United States wholesale markets by using local prices and plant-specific generation profiles. We determine how each plant loses (or gains) value because of its output profile, transmission congestion, and curtailment. In regions where wind or solar account for roughly 20% of electricity generation, its value is 30% to 40% below the regional average value of a flat output profile at all plants. Solar value reductions are most sensitive to output profile and wind value reductions are sensitive to both profile and congestion, region dependent. Curtailment was not a major source of value reduction.
Introduction
Variable renewable energy (VRE), referring to solar and wind power in this study, is essential to cost-effectively decarbonizing the electricity grid. As VRE provides a greater portion of electricity, the value of electricity during windy or sunny hours declines due to the low marginal cost of VRE. This value decline might be larger than future cost declines because of learning.1,2 Other studies expect substantial VRE cost declines3–6 but highlight the key challenge of value decline (or more generally, system integration questions7–10). The possibility of losing the race between declining cost and value puts decarbonization goals at risk and has led to calls for ambitious research and development efforts to cut the cost of VRE technology11 or for more direct policy support.12 Although there is no consensus as to the exact portion of future electricity generation VRE might provide, it is clear that the relatively low cost of VRE generation means that high penetrations are feasible and that the scope of VRE value decline will heavily influence VRE’s deployment potential.
The mechanics of VRE value decline are complex, producing varying results across regions and time periods. This is evidenced by the variety of results found in empirical studies from Europe,13–25 Australia,26 and the United States.27–31 These studies mostly focus on a concept related to VRE value decline, the ‘‘merit order effect,’’ which quantifies the deflation of overall average wholesale power prices due to VRE output. There are only a limited number of empirical studies in the United States that focus specifically on how wind or solar values differ from average electricity values. Studies in Texas32 and California33,34 evaluate the relatively low value of VRE generation (versus average electricity value), and highlight interesting dynamics between VRE and other types of power plants (for example, solar generation has improved the value of flexible gas combustion turbine plants in relation to combined cycle plants). Brown and Sullivan35 calculated solar value at all electric system price nodes. They also evaluated the solar value decline between 2010 and 2017. These studies provide important insights into value decline in the US but leave a number of questions unanswered. Specifically, existing peer-reviewed empirical studies in the US do not provide a national assessment of wind value decline and do not assess the relative importance of different underlying causes of value decline. These topics are important to study because the first step toward designing effective value decline mitigation strategies is to understand the root causes of value decline and how these causes vary by location and technology.
We address these research gaps by providing an empirical assessment of the gridsystem value of 2,100 existing utility-scale wind and solar plants across the contiguous US. We use the term ‘‘value’’ to reflect the energy and capacity revenue potential for wind and solar generation in a wholesale market environment. We analyze regional differences in value decline over the past decade. We then assess, for each plant, what causes the difference between its value and the overall average value of electricity. To do this, we decompose the observed value differences into three separate causes: output profile, transmission congestion, and curtailment. This decomposition loosely builds on concepts from modeling efforts9,36 and complements evaluations of VRE integration costs37–40 and efforts to identify value decline mitigation strategies.8,41–45 We also compare recent value decline trends with forward-looking modeling studies, providing context for how these trends might evolve in the future. We take care to develop realistic temporal profiles of generation—each wind and solar plant is modeled individually, and the resulting output is then bias corrected with a combination of records from various sources, including hourly records where available. We estimate hourly plant-level curtailment on the basis of plant characteristics, regional curtailment reports, and local pricing patterns. In the following sections, we first present overall trends to VRE value, followed by detailed analysis of value broken into the above-mentioned components. These results are followed by a brief comparison between value and cost trends. We conclude with a discussion of key insights relevant to system planners and policy makers…
Conclusions
In this paper, we have provided insight into the underlying mechanisms that have driven VRE value decline in the US. To do this, we found the difference in value between generation at each plant versus flat profile (or ‘‘flat block’’) generation at all power plants in a region. We then decomposed this value difference into three separate causes: output profile, transmission congestion, and curtailment, and we tracked their trends over time. This empirical analysis shines a light on the geographic heterogeneity of VRE value decline with penetration. This heterogeneity was mostly driven by differences in the levels of transmission congestion facing VRE output. In contrast, the decline in value of VRE output profiles was more closely correlated with penetration levels across regions. To date, curtailment levels were relatively low, and had relatively little impact on VRE value. We summarized mitigation strategies that would be most effective in addressing congestion or profile value reductions, and a simple take-away point is that different, and targeted, value decline mitigation strategies should be pursued in each region, at least in the near term.
There are a number of policy and regulatory changes that could support such mitigation strategies. For regions and VRE types where profile leads to substantial value decline (e.g., CAISO and ISO-NE solar, ERCOT and SPP wind), regulations related to storage and load profile modification might be most useful to target. For example, most proposed battery capacity in the interconnection queues is coupled with new VRE plants (mostly solar) as opposed to being standalone storage.63 Yet, these coupled (or ‘‘hybrid’’) plants often present a challenge with respect to existing regulations because coupled plants are new (and evolving) and existing regulations for standalone VRE or standalone storage are not always easily adaptable to coupled plants. Gorman et al.63 identify a set of eight key challenges, which, if addressed, would facilitate full participation of coupled plants in markets and thus help support the overall storage adoption. The challenges range from defining rules around generation forecasting to refining interconnection processes to enhancing resource planning models.
Related to load profile modification, dynamic retail rates, i.e., rates that allow for greater representation of hourly variability in wholesale prices, such as ‘‘time-ofuse’’ pricing, are an important regulatory tool to shift a portion of load across hours of the day (for example, reducing demand by 5% in peak times).64–66 Carefully developed retail rate structures might also effectively guide electric vehicle charging toward times of greatest benefit.67 Other long-term options exist for modifying load profile, including scheduling high-load industrial processes for low-cost hours, such as hydrogen production or desalinization.66
For regions where transmission congestion leads to substantial value decline (e.g., wind in SPP, MISO, and NYISO), reforms to the transmission planning process are essential. Analyses suggest that existing transmission planning processes were not designed to adapt to the speed of VRE deployment, and that, in particular, the rules surrounding who pays for new transmission and when new transmission builds are triggered, are particularly detrimental to VRE deployment and slow infrastructure project development needed to alleviate congestion.68,69
Although the above mitigation strategies and policy and regulatory topics are appropriate responses to the value decline observed to date, achieving long-term decarbonization goals requires that we keep in mind a larger perspective that compares future VRE value and cost. To achieve this perspective, we must combine the empirical results described in this paper with studies that simulate value decline into the future.
Some models indicate, as highlighted in the previous sections, that value decline might soon get worse. Our empirical analysis provides little solace on that front, that is, there is no evidence yet that the real world is behaving substantially differently from what was predicted years ago. Yes, transmission congestion is more geographically heterogeneous than is often described in system simulations, but overall, the decline we have observed in profile value, and even overall value, largely confirms the shape and magnitude of modeled predictions of value decline.
From one perspective, the trends described above leave VRE in a precarious position. Value decline to date has been matched and beaten by cost declines. But forward-looking models, which have been roughly correct to date, suggest that we will soon enter a regime of accelerating value decline. If the rate of cost declines levels out, we could soon see a situation where value decline outpaces cost decline, slowing VRE deployment. To avoid this slow down, value decline mitigation strategies would need to be employed, but the policy and regulatory changes required of these strategies take time. Thus, value decline mitigation efforts would need to begin before the value curve crosses back below the cost curve (see Figure 8), but it is more challenging to motivate action when costs are currently below value. This perspective is perhaps more relevant to wind, which compared with solar, faces greater congestion value decline, has reached relatively high penetration in multiple regions, and whose drivers of value decline are not addressed as well by short-duration (4 to 8 h) storage.
The substantial time needed to implement transmission value decline mitigation measures is one reason why multiple research efforts call for work to begin on more far ranging policy actions than described above.68,70,71 From this perspective, the key action needed is expanded inter-regional transmission. Even though inter-regional transmission is often part of longer-term strategies for deep decarbonization,72,73 there is a push to begin the process now. This push is driven by the long lead times needed for transmission construction and because existing high-VRE systems (e.g., SPP and MISO) would already benefit from multiregional transmission planning.68–71 In our analysis, we tested the impact of intra-regional transmission on the congestion component of value reductions, but inter-regional transmission might address all three of the value decline components we have examined. The important concept here is that long-distance, high-voltage transmission can link regions with different demand and VRE profiles to each other, and that these profile differences occur over various time frames ranging from diurnal to seasonal.70
An alternate, more optimistic perspective can also be presented. Optimism, in this case, is based on the recent decline in battery storage costs.74 Multiple modeling studies have shown that low-cost energy storage can effectively mitigate VRE curtailment, or value decline, out to VRE penetration levels of 50% (for combined wind and solar).8,72,75–77 In CAISO, for example, simulations of low-cost storage at high VRE penetration were shown to increase prices during relatively low priced sunny hours, significantly increasing the value of solar at high penetrations.8,77 In ERCOT, simulations show that low-cost, short-duration (4 to 8 h) storage can cut curtailment of VRE roughly in half at penetrations near 50%, even when total VRE is weighted toward wind.76 Finally, a simulation of high VRE penetration in 2050 indicated that multiple pathways exist to achieve the needed grid flexibility with high VRE penetration and specifically that storage can be part of an effective solution even when inter-regional transmission is limited.72
We therefore conclude on a mixed note of positivity and caution. We have found that cost decline has taken a recent lead in the race versus value decline. VRE deployment thus continues at a healthy rate. However, some modeling analyses point to the threat of accelerated value decline and the resulting slowing of VRE deployment, and our empirical analysis does not contradict this assessment. Yet, recent declines in battery storage costs and the trend toward low specific power wind plants suggests that options to slow value decline might be more cost effective than previously modeled. This leaves open the question of how aggressively policy makers should pursue value decline mitigation strategies. Are targeted regional strategies sufficient to ensure decarbonization goals, or should stronger efforts be made in the near term, such as to develop inter-regional transmission or more aggressively subsidize storage? Research might help to illuminate the factors needed to make these decisions. Simulations of value decline could be updated to reflect design changes to new wind, solar, and coupled storage plants. Continued empirical analyses are needed to highlight evolving regional dynamics. Stakeholders can then evaluate policy tradeoffs given the evolving information…
posted by Herman K. Trabish @ 7:07 AM
0 comments
![]()
NewEnergyNews has passed the 3.8 MILLION page views milestone!

------------------------
------------------------
------------------------
FEATURED BOOKS:
-------------------
NOTEWORTHY IN THE MEDIA:
NewEnergyNews would welcome any media-saavy volunteer who would like to re-develop this section of the page. Announcements and reviews of film, television, radio and music related to energy and environmental issues are welcome.
------------------------
------------------------
THE LAST TWO MONTHS
WEEKEND VIDEOS, June 24-25
WEEKEND VIDEOS, June 17-18
WEEKEND VIDEOS, June 10-11
WEEKEND VIDEOS, June 3-4
WEEKEND VIDEOS, May 27-28
WEEKEND VIDEOS, May 20-21
THINGS-TO-THINK-ABOUT WEDNESDAY, April 19:
THINGS-TO-THINK-ABOUT WEDNESDAY, April 12:
THINGS-TO-THINK-ABOUT WEDNESDAY, April 5:
THINGS-TO-THINK-ABOUT WEDNESDAY, March 29:
THINGS-TO-THINK-ABOUT WEDNESDAY, March 22:
THINGS-TO-THINK-ABOUT WEDNESDAY, March 2:
THINGS-TO-THINK-ABOUT WEDNESDAY, February 22:
FRIDAY WORLD, February 17:
THINGS-TO-THINK-ABOUT WEDNESDAY, February 15:
THINGS-TO-THINK-ABOUT WEDNESDAY, February 8:
THINGS-TO-THINK-ABOUT WEDNESDAY, February 1:
MONDAY STUDY AT NewEnergyNews, January 30:
THINGS-TO-THINK-ABOUT WEDNESDAY, January 18:
THINGS-TO-THINK-ABOUT WEDNESDAY, January 11:
THINGS-TO-THINK-ABOUT WEDNESDAY, January 4:
THINGS-TO-THINK-ABOUT WEDNESDAY, December 21:
THINGS-TO-THINK-ABOUT WEDNESDAY, December 14:
THINGS-TO-THINK-ABOUT WEDNESDAY, December 7:
THINGS-TO-THINK-ABOUT WEDNESDAY, November 30:
THINGS-TO-THINK-ABOUT WEDNESDAY, November 23:
Links
 Plug-in Hybrids, The Cars That Will Recharge America
 Oil On The Brain
Current Posts
Archives
*


 click to enlarge
 click to enlarge
 click to enlarge
 click to enlarge
 click to enlarge
 click to enlarge
 click to enlarge
 click to enlarge
 click to enlarge
 click to enlarge
 click to enlarge
 click to enlarge
 click to enlarge
 click to enlarge
 click to enlarge
 click to enlarge
 click to enlarge
 click to enlarge
 click to enlarge
 click to enlarge
 click to enlarge
 click to enlarge
 click to enlarge
 click to enlarge
 click to enlarge
 click to enlarge
 click to enlarge
 click to enlarge
 click to enlarge
 click to enlarge
 click to enlarge
 click to enlarge
 click to enlarge
 click to enlarge
 click to enlarge
 click to enlarge
 click to enlarge
 click to enlarge
 click to enlarge
 click to enlarge
 click to enlarge
 click to enlarge
 click to enlarge
 click to enlarge
 click to enlarge
 click to enlarge
 click to enlarge
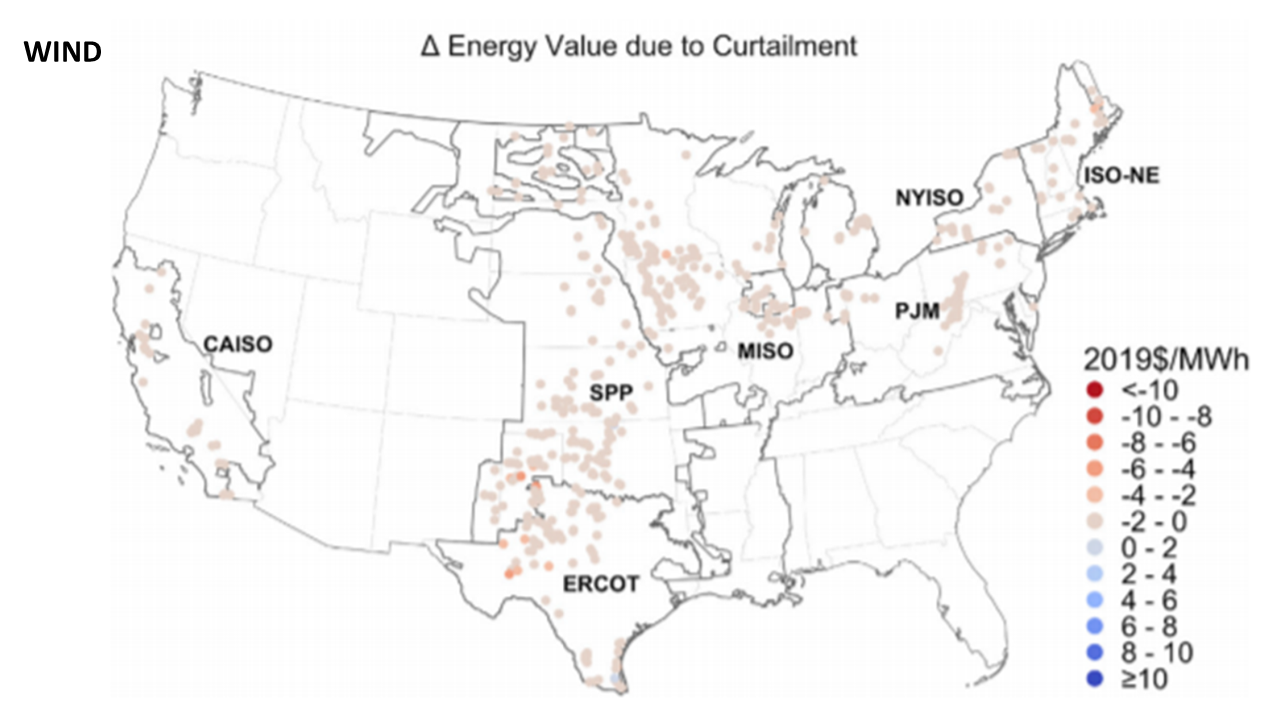 click to enlarge
 click to enlarge
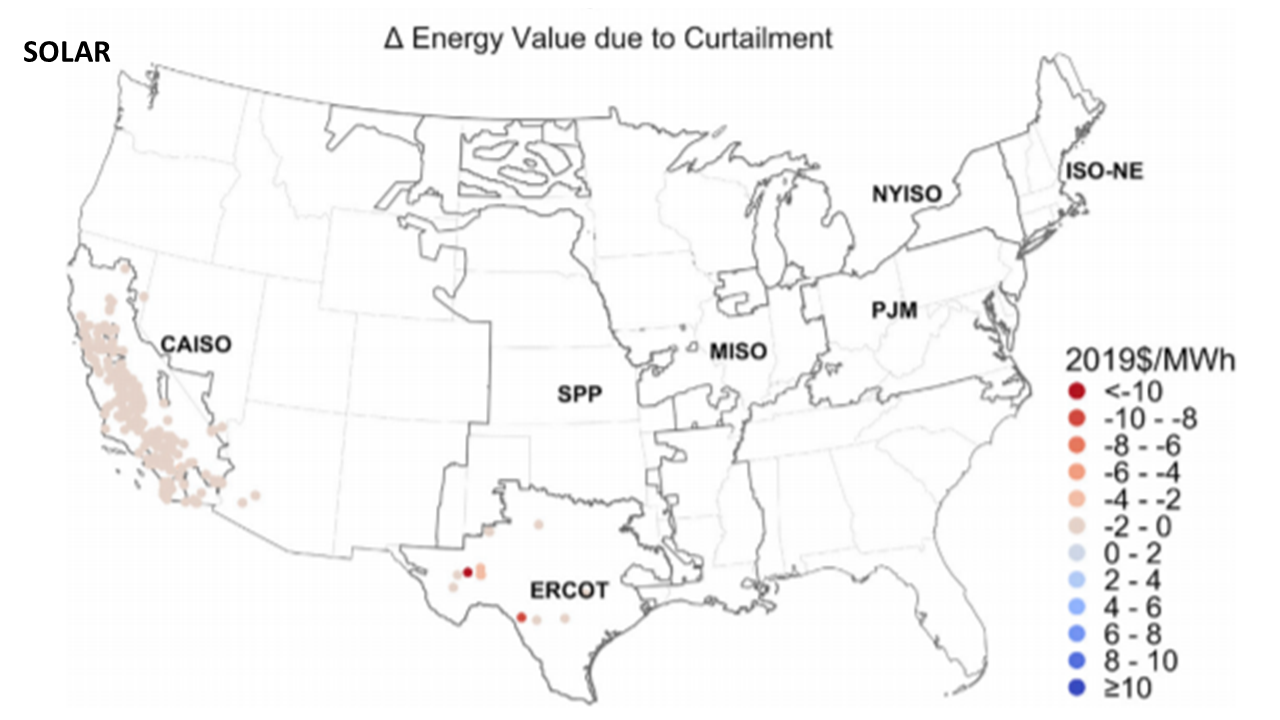 click to enlarge
 click to enlarge

