

Monday Study – The Land New Energy Needs
Power of Place – West August 2022 (The Nature Consercancy)
Power of Place Principles
The following principles should guide energy planning and policy to achieve better outcomes for climate, conservation, and communities.
Better for Nature – Advance energy siting policies and solutions that limit negative impacts to natural areas and working lands.
Reliable – Ensure reliable clean energy for people.
Resilient – Plan for an energy system that can withstand the impacts of climate change by minimizing vulnerability to wildfires, flooding, and drought.
Affordable – Develop cost-effective clean energy pathways for consumers.
Equitable – Ensure front line communities have a lead role in our clean energy future as beneficiaries and decision-makers.
Clean – Accelerate clean energy deployment to reduce emissions and pollution.
Introduction
In 2019 The Nature Conservancy released the Power of Place California report analyzing the land use requirements and conservation impacts of clean energy pathways in the state. This unprecedented effort showed that it is possible to largely avoid impacts to natural areas and working lands while decarbonizing the electricity sector. Just as important, the study showed California can achieve both climate and conservation goals without increasing costs or decreasing reliability. Since then, six western states1 have set clean energy goals that will reduce greenhouse gas emissions by 2050. Power of Place –West expands on the California study by including economy-wide energy demand in the eleven Western Interconnection states. The analysis includes the power, transportation, heating, and manufacturing sectors as well as a full suite of carbon neutral energy technologies (e.g., solar, onshore and offshore wind, geothermal, biomass, hydrogen, nuclear, gas with carbon capture, and direct air capture).
The Power of Place –West study was designed to answer several questions including:
• How much clean energy will be needed to achieve economy-wide net-zero emission reductions by 2050?
• How much land and ocean area will be required for the clean energy transition?
• How will protecting sensitive natural areas and working lands affect energy costs?
• What are the implications of renewable and carbon-neutral energy technology choices on natural and working lands, costs, and the pace of build-out?
The study shows the scale and pace of energy infrastructure build-out in the region will be unprecedented and, enormous, but surprisingly affordable. It also highlights that the western United States is endowed with abundant and diverse renewable energy resources interspersed with some of the most intact natural areas and productive working lands in the country. This study demonstrates we can achieve our climate goals with 21 million acres, or less, of new energy infrastructure by 2050.
The Power of Place –West study shows the West can achieve both climate and conservation goals. Three topline findings indicate: 1) The West can achieve net-zero economy-wide reductions by 2050 while avoiding most sensitive natural areas and working lands; 2) energy planning that includes land use considerations can dramatically reduce conservation impacts with minimal additional cost; and 3) combining rapid electrification, renewable energy, and the full array of carbon neutral energy technologies is an optimal approach.
To take advantage of these findings we need to act now. The West has a few years to improve energy policies and planning to fully account for environmental impacts and engage local stakeholders to accelerate deployment in low-impact areas. Not doing so will spark greater local resistance and associated delays and cost increases, putting mid-century net-zero emission goals at risk.
Key Results
The Power of Place –West study primarily considers two net-zero scenarios, a ‘high electrification’ scenario and a ‘renewables only’ scenario, to supply the 1.7 to 2.5 terawatts of clean energy and fuels needed to power the west, economy-wide, in 2050. These two scenarios represent the economywide decarbonization approaches most frequently considered in state and federal policy settings. These scenarios are not predictive. Each scenario illustrates different decarbonization approaches that can be used to identify policies and processes needed to achieve net-zero.
We can achieve economy-wide net-zero greenhouse gas (GHG) emissions reductions across the West while avoiding most sensitive natural areas and working lands. With existing legal land use restrictions, the model identified the development of up to 39 million acres of new clean energy infrastructure and transmission to meet net-zero. With improved statewide and regional energy planning and siting practices, we can avoid the conversion of almost 50% of those lands, including 10 million acres of high-quality habitat, and achieve our climate and conservation goals by developing just 21 million acres in areas with lower conservation value. Clean energy infrastructure development, under existing land use constraints, is likely to cause widespread impacts to habitats, wildlife, prime agricultural lands, and local communities across the western United States.
Impacts to sensitive natural and working lands can be avoided at minimal additional cost. By 2050, the 2018 net present value of the investment in the clean energy transition is $260 billion dollars in the West. The total cost of the clean energy transition will increase by 3% by 2050 when we commit to protecting the most important natural areas and working lands in the West and take advantage of all available low-carbon energy technologies in the ‘high electrification’ scenario. If we limit technologies in the ‘renewables only’ scenario, the cost of getting to net-zero with increased environmental protection is 10% higher, as seen in Figure 1.
High voltage transmission capacity needs can be met through a combination of co-location, reconductoring, and strategically sited new transmission corridors. The current high voltage transmission network in the West totals 86,000 miles. More than half of the additional capacity needed to support net-zero in the West can be achieved by targeting grid upgrades (i.e., reconductoring) and co-locating additional capacity within 6,700 to 7,600 miles of existing electrical utility rights-of-way (ROW), as seen in the table in Figure 2. The length of new ROW corridors needed for additional high voltage transmission lines under the ‘high electrification’ scenario is only 6,259 miles. The model sites as much as 16 GW of transmission capacity in these new ROW corridors. There are many ways to accommodate additional capacity in a new corridor. Some ROW corridors will need to be sized up to allow for multiple high voltage transmission lines. Minimizing the development of new ROW corridors could reduce barriers associated with ROW permitting. More efficient use of new ROWs means that it is possible to more than double the megawatt-miles of transmission, while only increasing total distance of lines by 7-8%. Figure 2 illustrates the potential electrical transmission corridors by 2050 under the ‘high electrification’ scenario.
A high level of environmental protection creates a shift away from wind in the Intermountain West to solar in the Southwest. High quality wind resources are more sensitive to higher levels of environmental protection because they utilize more land area and, therefore, intersect with terrestrial and avian wildlife corridors. When we increase protection of natural areas and working lands, we can expect a shift from onshore wind in the interior western states to more solar in California and the Southwest, closer to substations and demand centers, as illustrated in Figure 3.
Offshore wind accounts for 10-20% of the wind necessary to achieve net-zero in 2050 and less than 1 million acres of ocean area. The relative abundance of on shore wind resources in the West and long transmission distances to load centers contributes to less demand for offshore wind. Between the ‘high electrification’ scenario and the ‘renewables only’ scenario the range of offshore wind needed is between 16-26 GW within 50 nautical miles of the West Coast by 2050. Figure 4 illustrates the off shore wind potential and ocean areas for potential development when we increase environmental protections
Working lands will host a significant share of new solar, wind, and transmission development. A significant amount of infrastructure required for the clean energy transition will be sited on prime agricultural lands if we continue with business as usual — as many as 2.7 million acres. With improved statewide and regional energy planning and siting practices, we can avoid solar siting on prime farmland and focus new energy development on marginal2 agricultural lands.
Annual build rates and land requirements vary considerably across clean energy pathways. The ‘high electrification’ scenario will require a four-fold increase in the construction rate of clean energy infrastructure by 2050 with a buildout of 21 million acres of land. Going with ‘renewables only’ technologies will require an eight-fold increase in the current construction rate by 2050 and 26 million acres of land.
The ‘high electrification’ scenario is the optimal decarbonization pathway for climate and conservation. When we take advantage of all commercially available clean energy technologies to achieve our 2050 climate goals, we use less land, limit costs, require less transmission, and we increase the likelihood of successfully accelerating the rate of construction of clean energy infrastructure by mid-century. Reducing the need for new clean energy transmission and infrastructure, in the long run, will reduce the potential for conflicts with important conservation lands.
We have only a few years to create plans, policies, and incentives to facilitate low-impact clean energy deployment. The need for dramatic expansion and development of clean energy infrastructure will accelerate later in this decade and it is imperative that we invest now in West-wide energy planning efforts to chart low-impact pathways to our net-zero future. These proactive steps are critical if we are to achieve the pace and scale of clean energy deployment necessary to meet our climate goals while ensuring that natural areas and working lands are protected.
Policy Recommendations
The Power of Place –West study demonstrates a significant amount of land will be required to deploy solar, wind, transmission, and other clean energy technologies as part of an economy-wide effort to achieve net-zero GHG emissions in the United States. As western states set renewable or clean energy and GHG emission reduction goals, it is important that land and water use, equity, and climate impacts are considered in the energy transition. Not considering these values may result in harm to wildlife, ecosystems, cultural resources, vulnerable communities, and iconic landscapes, perpetuate climate change impacts, generate community opposition, and delay the transition to clean energy.
The following policy recommendations are informed by Power of Place –West study results:
1 Improve energy and decarbonization planning to maximize community, conservation and economic benefits.
Six western states have ambitious greenhouse gas emission reduction targets by 2050 or earlier. To achieve these goals, it is imperative coordination among local, state, regional, and federal planning and permitting organizations be improved. Long-term decarbonization and energy planning should factor in climate, land and water conservation, and community goals to achieve optimal outcomes and win broad public support. To achieve these goals, Power of Place –West provides a framework to guide clean energy planning efforts:
• Use spatially explicit energy planning to identify and designate ‘Priority Renewable Energy Areas,’ or those areas where high-quality wind or solar development will maximize community benefits and grid resiliency, while avoiding significant negative environmental and social impacts.
• Prioritize investments in co-locating transmission lines and reconductoring existing lines while continuing to plan for new low-impact transmission investments when connecting ‘Priority Renewable Energy Areas’ to demand centers.
• Adopt an inclusive participatory planning process to ensure that economic and environmental benefits and burdens from decarbonization are shared equitably. Engage indigenous and frontline communities in guiding clean energy infrastructure and land use planning decision-making.
2 Streamline review of projects in ’Priority Renewable Energy Areas’ by federal, state, and local governments.
Every economy-wide net-zero scenario requires a significant buildout of renewable energy in the coming decades. Policies and funding should incentivize and facilitate development of renewable energy infrastructure — new generation, transmission, and storage — in areas with high resource potential, low conflict, and where transmission investments are optimized.
• Design and implement regional programmatic approaches to environmental review in ‘Priority Renewable Energy Areas
• Expedite permitting and approval processes for projects in designated ‘Priority Renewable Energy Areas,’ where programmatic environmental reviews have already been completed.
• Prioritize and incentivize low-conflict transmission infrastructure investments that connect ‘Priority Renewable Energy Areas’ to demand centers.
3 Develop state and federal mitigation programs that require clean energy infrastructure to avoid, minimize, or offset impacts to wildlife, ecosystems, cultural resources, and iconic landscapes.
This approach reinforces the value of Priority Renewable Energy Areas and supports a more consistent and predictable application of mitigation requirements across the West.
4 Ensure energy siting on working lands benefits agricultural communities.
Approximately half of wind and solar projects in the West are now being deployed on lands classified as agricultural. Clean energy infrastructure can either be integrated into agricultural operations or sited on marginally productive and retired farmlands to minimize competition for land and maximize co-benefits for farmers.
• Adopt state and local policies to allow clean energy infrastructure (including battery storage and emerging technologies such as direct air capture) as a permitted use in agricultural zones, especially non-prime farmlands.
• Consider the use of special exceptions3 for clean energy infrastructure on non-prime agricultural lands. Criteria for special exceptions, or variances, might include reasonable setbacks, grading and filling impacts on soil productivity, and/or management of stormwater.
• Consider the use of Community Benefit Agreements with energy developers and utilities to ensure that the benefits of the clean energy transition, such as local grid reliability and energy independence, accrue locally.
5
5 Create a West-wide market that includes planning and coordination to develop the most cost-effective and reliable grid.
The Power of Place - West study indicates that there are a multitude of benefits of an interconnected regional grid, including the potential savings of $2B from avoided infrastructure costs.
6 The energy technologies we choose on the path to carbon neutrality matter.
The Power of Place – West study demonstrates the ‘high electrification’ scenario, which takes advantage of all commercially available clean energy technologies, is optimal for achieving our climate and conservation goals. Energy efficiency and distributed energy are necessary in all economy-wide scenarios as we make this clean energy transition. Taking advantage of existing, commercial low and no-carbon fuels and technologies to meet our energy needs between now and 2050 can reduce costs and the demand for new renewable energy infrastructure and transmission. Federal, state, and local energy policies, should provide flexibility around clean energy technologies to allow for a cost-effective transition that minimizes impacts to natural and working lands…
 click to enlarge
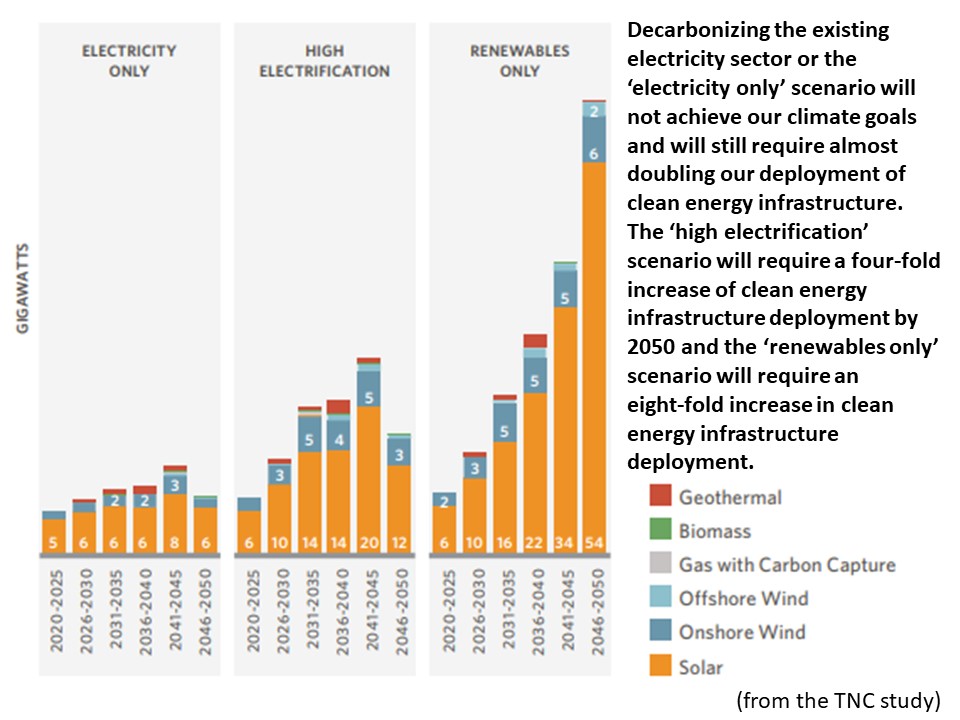 click to enlarge
 click to enlarge
 click to enlarge
 click to enlarge
 click to enlarge
posted by Herman K. Trabish @ 6:40 AM
0 comments
![]()
 click to enlarge
 click to enlarge
 click to enlarge
 click to enlarge
 click to enlarge
 click to enlarge
 click to enlarge
 click to enlarge
 click to enlarge
 click to enlarge
 click to enlarge
 click to enlarge
 click to enlarge
 click to enlarge
 click to enlarge
 click to enlarge
 click to enlarge
 click to enlarge
 click to enlarge
 click to enlarge
 click to enlarge
 click to enlarge
 click to enlarge
 click to enlarge
 click to enlarge
 click to enlarge
 click to enlarge
 click to enlarge
 click to enlarge
 click to enlarge
 click to enlarge
 click to enlarge
 click to enlarge
 click to enlarge
 click to enlarge
 Plug-in Hybrids, The Cars That Will Recharge America
 Oil On The Brain


