Renewables 2012 Global Status Report
June 2012 (Renewable Energy Policy Network for the 21st Century)
Key Findings
Renewable energy markets and policy frameworks have evolved rapidly in recent years. This report provides a comprehensive and timely overview of renewable energy market, industry, investment, and policy developments worldwide. It relies on the most recent data available, provided by a network of more than 400 contributors and researchers from around the world, all of which is brought together by a multi-disciplinary authoring team. The report covers recent developments, current status, and key trends; by design, it does not provide analysis or forecast the future.
As such, this report and subsequent editions will serve as a benchmark for measuring global progress in the deployment of renewable energy, which is of particular interest in this International Year of Sustainable Energy for All. UN Secretary-General Ban Ki-moon has marked the occasion with a new global initiative, Sustainable Energy for All, which seeks to mobilise global action on three interlinked objectives to be achieved by 2030: universal access to modern energy services, improved rates of energy efficiency, and expanded use of renewable energy sources.
 click to enlarge
Renewable Energy Growth in All End-Use Sectors
Renewable energy sources have grown to supply an estimated 16.7% of global final energy consumption in 2010. Of this total, modern renewable energy accounted for an estimated 8.2%, a share that has increased in recent years, while the share from traditional biomass has declined slightly to an estimated 8.5%. During 2011, modern renewables continued to grow strongly in all end-use sectors: power, heating and cooling, and transport.
In the power sector, renewables accounted for almost half of the estimated 208 gigawatts (GW) of electric capacity added globally during 2011. Wind and solar photovoltaics (PV) accounted for almost 40% and 30% of new renewable capacity, respectively, followed by hydropower (nearly 25%). By the end of 2011, total renewable power capacity worldwide exceeded 1,360 GW, up 8% over 2010; renewables comprised more than 25% of total global power-generating capacity (estimated at 5,360 GW in 2011) and supplied an estimated 20.3% of global electricity. Non-hydropower renewables exceeded 390 GW, a 24% capacity increase over 2010.
The heating and cooling sector offers an immense yet mostly untapped potential for renewable energy deployment. Heat from biomass, solar, and geothermal sources already represents a significant portion of the energy derived from renewables, and the sector is slowly evolving as countries (particularly in the European Union) are starting to enact supporting policies and to track the share of heat derived from renewable sources. Trends in the heating (and cooling) sector include an increase in system size, expanding use of combined heat and power (CHP), the feeding of renewable heating and cooling into district networks, and the use of renewable heat for industrial purposes.
 click to enlarge
Renewable energy is used in the transport sector in the form of gaseous and liquid biofuels; liquid biofuels provided about 3% of global road transport fuels in 2011, more than any other renewable energy source in the transport sector. Electricity powers trains, subways, and a small but growing number of passenger cars and motorised cycles, and there are limited but increasing initiatives to link electric transport with renewable energy.
Solar PV grew the fastest of all renewable technologies during the period from end-2006 through 2011, with operating capacity increasing by an average of 58% annually, followed by concentrating solar thermal power (CSP), which increased almost 37% annually over this period from a small base, and wind power (26%).
Demand is also growing rapidly for solar thermal heat systems, geothermal ground-source heat pumps, and some solid biomass fuels, such as wood pellets. The development of liquid biofuels has been mixed in recent years, with biodiesel production expanding in 2011 and ethanol production stable or down slightly compared with 2010. Hydropower and geothermal power are growing globally at rates averaging 2–3% per year. In several countries, however, the growth in these and other renewable technologies far exceeds the global average.
 click to enlarge
Renewables represent a rapidly growing share of energy supply in a number of countries and regions:
* In the European Union, renewables accounted for more than 71% of total electric capacity additions in 2011, bringing renewable energy’s share of total electric capacity to 31.1%. Solar PV alone represented almost 47% of new capacity that came into operation.
The renewable share of consumption is rising in parallel (although not as rapidly since much of the capacity is variable solar and wind). In 2010 (latest available data), the renewable share of total electricity consumption was 19.8% (up from 18.2% in 2009), and renewables represented 12.4% of gross final energy consumption (compared to 11.5% in 2009).
* Germany continues to lead in Europe and to be in the forefront globally, remaining among the top users of many renewable technologies for power, heating, and transport. In 2011, renewables provided 12.2% of Germany’s final energy consumption, 20% of electricity consumption (up from 11.6% in 2006), 10.4% of heating demand (up from 6.2%), and 5.6% of transport fuel (excluding air traffic).
* In the United States, renewable energy made up an estimated 39% of national electric capacity additions in 2011. The share of U.S. net electricity generation from non-hydropower renewables has increased from 3.7% in 2009 to 4.7% in 2011. Nine states generated more than 10% of their electricity with non-hydro renewables in 2011, up from two states a decade ago. All renewables accounted for about 11.8% of U.S. primary energy production in 2011, up from 10.9% in 2010.
*China ended 2011 with more renewable power capacity than any other nation, with an estimated 282 GW; one-quarter of this total (70 GW) was non-hydro. Of the 90 GW of electric capacity newly installed during the year, renewables accounted for more than one-third, and non-hydro renewables were more than one-fifth.
*Several countries and states met higher shares of their electricity demand with wind power in 2011 than in 2010, including Denmark, where wind provided nearly 26% of electricity demand, Spain (15.9%), and Portugal (15.6%); four German states met more than 46% of their electricity needs with wind; the state of South Australia generated 20% of its demand from wind; and the U.S. states of South Dakota and Iowa produced 22% and 19% of their power from wind, respectively.
 click to enlarge
The top seven countries for non-hydro renewable electric capacity—China, the United States, Germany, Spain, Italy, India, and Japan—accounted for about 70% of total capacity worldwide. The ranking was quite different on a per-person basis, with Germany in the lead followed by Spain, Italy, the United States, Japan, China, and India.
By region, the EU was home to nearly 44% of global non-hydro renewable capacity at the end of 2011, and the BRICSi nations accounted for almost 26%; their share has been increasing in recent years, but virtually all of this capacity is in China, India, and Brazil.
Even so, renewable technologies are expanding into new markets. In 2011, around 50 countries installed wind power capacity, and solar PV capacity is moving rapidly into new regions and countries. Interest in geothermal power has taken hold in East Africa’s Rift Valley and elsewhere, and solar hot water collectors are used by more than 200 million households, as well as in many public and commercial buildings the world over. Interest in geothermal heating and cooling is on the rise in countries around the world, and the use of modern biomass for energy purposes is expanding in all regions of the globe.
Across most technologies, renewable energy industries saw continued growth in equipment manufacturing, sales, and installation during 2011. Solar PV and onshore wind power experienced dramatic price reductions resulting from declining costs due to economies of scale and technology advances, but also due to reductions or uncertainties in policy support. At the same time, some renewable energy industries—particularly solar PV manufacturing—have been challenged by falling prices, declining policy support, the international financial crisis, and tensions in international trade. Continuing economic challenges (especially in traditional renewable energy markets) and changing policy environments in many countries contributed to some industry uncertainties or negative outlooks, and over the course of the year there was a steady decline in new projects proposed for development.
 click to enlarge
A Dynamic Policy Landscape
At least 118 countries, more than half of which are developing countries, had renewable energy targets in place by early 2012, up from 109 as of early 2010. Renewable energy targets and support policies continued to be a driving force behind increasing markets for renewable energy, despite some setbacks resulting from a lack of long-term policy certainty and stability in many countries.
The number of official renewable energy targets and policies in place to support investments in renewable energy continued to increase in 2011 and early 2012, but at a slower adoption rate relative to previous years.
Several countries undertook significant policy overhauls that have resulted in reduced support; some changes were intended to improve existing instruments and achieve more targeted results as renewable energy technologies mature, while others were part of the trend towards austerity measures.
Renewable power generation policies remain the most common type of support policy; at least 109 countries had some type of renewable power policy by early 2012, up from the 96 countries reported in the GSR 2011.
Feed-in-tariffs (FITs) and renewable portfolio standards (RPS) are the most commonly used policies in this sector. FIT policies were in place in at least 65 countries and 27 states by early 2012. While a number of new FITs were enacted, most related policy activities involved revisions to existing laws, at times under controversy and involving legal disputes. Quotas or Renewable Portfolio Standards (RPS) were in use in 18 countries and at least 53 other jurisdictions, with two new countries having enacted such policies in 2011 and early 2012.
Policies to promote renewable heating and cooling continue to be enacted less aggressively than those in other sectors, but their use has expanded in recent years. By early 2012, at least 19 countries had specific renewable heating/cooling targets in place and at least 17 countries and states had obligations/mandates to promote renewable heat. Numerous local governments also support renewable heating systems through building codes and other measures. The focus of this sector is still primarily in Europe, but interest is expanding to other regions.
Regulatory policies supporting biofuels existed in at least 46 countries at the national level and in 26 states and provinces by early 2012, with three countries enacting new mandates during 2011 and at least six increasing existing mandates. Transport fuel-tax exemptions and biofuel production subsidies also existed in at least 19 countries. At the same time, Brazil’s mandated ethanol blend level was reduced, partly in response to low sugarcane yields, while long-term ethanol support policies in the United States were allowed to expire at year's end.
Thousands of cities and local governments around the world also have active policies, plans, or targets for renewable energy and climate change mitigation. Almost two-thirds of the world’s largest cities had adopted climate change action plans by the end of 2011, with more than half of them planning to increase their uptake of renewable energy. Many of the institutions encouraging co-operation among cities in local renewable energy deployment saw increased membership and activities in 2011, including the EU Covenant of Mayors (with over 3,000 member cities). Most activity has occurred in North American and European cities, although 100 demonstration cities exist in China, and cities in Argentina, Australia, Brazil, India, Mexico, South Africa, South Korea, and elsewhere undertook initiatives to support renewable energy deployment in 2011.
Policymakers are increasingly aware of renewable energy’s wide range of benefits—including energy security, reduced import dependency, reduction of greenhouse gas (GHG) emissions, prevention of biodiversity loss, improved health, job creation, rural development, and energy access—leading to closer integration in some countries of renewable energy with policies in other economic sectors. Globally there are more than 5 million jobs in renewable energy industries, and the potential for job creation continues to be a main driver for renewable energy policies. During 2011, policy development and implementation were also stimulated in some countries by the Fukushima nuclear catastrophe in Japan and by the UN Secretary-General’s announced goal to double the
share of renewables in the energy mix by 2030.
There has been little systematic linking of energy efficiency and renewable energy in the policy arena to date, but countries are beginning to wake up to the importance of tapping their potential synergies. Efficiency and renewables can be considered the “twin pillars” of a sustainable energy future. Improving the efficiency of energy services is advantageous irrespective of the primary energy source, but there is a special synergy between energy efficiency and renewable energy sources. The more efficiently energy services are delivered, the faster renewable energy can become an effective and significant contributor of primary energy; and the more energy obtained from renewable sources, the less primary energy required to provide the same energy services.
In the EU, the United States, and elsewhere, countries are beginning to link the two through targets and policies; at the global level, the UN Secretary-General’s initiative on Sustainable Energy for All highlights the interlinkages among energy access, energy efficiency improvements, and renewable energy deployment. Policies have also begun to address the efficiency of renewable energy systems themselves.
 click to enlarge
Investment Trends
Global new investment in renewables rose 17% to a record USD 257 billion in 2011. This was more than six times the figure for 2004 and almost twice the total investment in 2007, the last year before the acute phase of the recent global financial crisis. This increase took place at a time when the cost of renewable power equipment was falling rapidly and when there was uncertainty over economic growth and policy priorities in developed countries. Including large hydropower, net investment in renewable power capacity was some USD 40 billion higher than net investment in fossil fuel capacity.
One of the highlights of 2011 was the strong performance of solar power, which blew past wind power, the biggest single sector for investment in recent years (although total wind power capacity added in 2011 was higher than for solar). Another highlight was the performance of the United States, where investment increased by 57% relative to 2010, mainly as the result of developers rushing to take advantage of federal support policies that were coming to an end.
The top five countries for total investment were China, which led the world for the third year running, followed closely by the United States, and by Germany, Italy, and India. India displayed the fastest expansion in investment of any large renewables market in the world, with 62% growth. Developing countries saw their relative share of total global investment slip back after several years of consistent increases; developing countries accounted for USD 89 billion of new investment in 2011, compared with USD 168 billion in developed countries.
 click to enlarge
Rural Renewable Energy: Special Focus
Significant technological innovation and cost reductions of renewable energy technologies, along with improved business and financing models, are increasingly creating clean and affordable renewable energy solutions for individuals and communities in developing countries.
For a majority of very remote and dispersed users, decentralised off-grid renewable electricity is less expensive than extending the power grid. At the same time, developing countries have begun deploying more and more grid-connected renewable capacity, which is in turn expanding markets and further reducing prices, potentially improving the outlook for rural renewable energy developments.
Rural renewable energy markets in developing countries differ significantly across regions: for example, Africa has by far the lowest rates of access to modern energy services, while Asia presents significant gaps among countries, and Latin America’s rate of electrification is quite high. In addition, active players in this sector are numerous, and participants differ from one region to the next. The rural renewable energy market is highly dynamic and constantly evolving; it is also challenged by the lack of structured frameworks and of consolidated data sets.
In addition to a focus on technologies and systems, most developing countries have started to identify and implement programmes and policies to improve the ongoing operational structures governing rural energy markets. Most countries are developing targets for electrification that include renewable off-grid options and/or renewably powered mini-grids; there is also some use of grid connected renewable electricity. In the rural cooking and heating market, advanced cookstoves fueled by renewable sources are gaining ground as reliable and sustainable alternatives to traditional biomass cookstoves. Such developments are increasing the attractiveness of rural energy markets and developing economies for potential investors.
After many years of relatively slow political, technical, financial, industrial, and related developments, them impressive deployment of all renewable energy technologies and notable cost reductions point to a brighter future. However, further efforts will be necessary to reach the outlined objectives: the International Energy Agency estimates that annual investment in the rural energy sector needs to increase more than fivefold to provide universal access to modern energy by 2030. 2011 Market and Industry Highlights and Ongoing Trends
 click to enlarge
WIND POWER.
Wind power capacity increased by 20% in 2011 to approximately 238 GW by year-end, seeing the greatest capacity additions of any renewable technology. As in 2010, more new capacity was added in developing countries and emerging markets than in OECD countries. China accounted for almost 44% of the global market (adding slightly less capacity than it did in 2010), followed by the United States and India; Germany remained the largest market in Europe. Although its market share remained relatively small, the offshore wind sector continued to expand, with the use of larger turbines and movement into deeper water, farther from shore. The trend towards increasing the size of individual wind projects and larger wind turbines continued; at the same time, the use of small-scale turbines is increasing, and interest in community wind power projects is on the rise in several countries.
 click to enlarge
SOLAR PHOTOVOLTAICs (PV).
Solar PV saw another year of extraordinary market growth. Almost 30 GW of operating capacity was added, increasing total global capacity by 74% to almost 70 GW. The trend towards very large-scale ground-mounted systems continued, while rooftop and small-scale systems continued to play an important role. For the first time ever, solar PV accounted for more capacity additions in the EU than any other technology. While the EU again dominated the global market, led by Italy and Germany, markets expanded in other regions, and China has rapidly emerged as the dominant player in Asia. Although 2011 was a good year for consumers and installers, manufacturers struggled to make profits or even survive amidst excess inventory and falling prices, declining government support, slower market growth for much of the year, and significant industry consolidation. Module manufacturing continued its marked shift to Asia, mainly at the expense of European firms.
 click to enlarge
BIOMASS FOR HEAT, POWER, AND TRANSPORT.
The growing use of biomass for heat, electricity, and transport fuels has resulted in increasing international trade in biomass fuels in recent years; wood pellets, biodiesel, and ethanol are the main fuels traded internationally. Biomass, in the form of both solid and gaseous fuels, continues to provide the majority of heating produced with renewable energy sources. Markets are expanding rapidly, particularly in Europe where biomass is used increasingly in district heat systems. Another growing trend, also taking place largely in Europe, is the use of biomethane (purified biogas) that can be injected directly into the natural gas network and used to produce heat and power and to fuel vehicles. Biogas produced from domestic-scale digesters is used increasingly for cooking, and to a smaller extent for heating and lighting, in China, India, and elsewhere.
Biomass power capacity increased from about 66 GW in 2010 to almost 72 GW at the end of 2011. The United States leads the world in biomass-based power generation, with other significant producers in the EU in addition to Brazil, China, India, and Japan. Most sugar producing countries in Africa generate power and heat with bagasse-based combined heat and power (CHP) plants. Improvements in the logistics of biomass collection, transport, and storage over the past decade, and growing international trade (particularly in pellets), have helped to remove constraints on plant size, and the size of facilities in some countries is increasing as a result.
Ethanol and biodiesel are the primary renewable fuels in the transport sector. During 2011, ethanol production remained stable or declined slightly for the first time in more than a decade, but biodiesel production continued to rise globally. Several airlines began to operate commercial flights using various biofuels blends, and interest in advanced biofuels continued to increase, although production levels remain relatively low. Limited but growing quantities of gaseous biofuels (mainly biomethane) are fuelling trains, buses, and other vehicles, particularly in Europe.
 click to enlarge
SOLAR THERMAL HEATING AND COOLING.
Solar heating capacity increased by an estimated 27% in 2011 to reach approximately 232 GWth, excluding unglazed swimming pool heating. China again led the world for solar thermal installations, with Europe a distant second. Most solar thermal is used for water heating, but solar space heating and cooling are gaining ground, particularly in Europe. The year 2011 was difficult for parts of the solar thermal industry due to the economic situation in northern Mediterranean countries and the general negative outlook across much of Europe. China remained dominant in the global solar heating industry, a position that it has held for several years, and export of Chinese products has increased considerably in recent years.
 click to enlarge
CONCENTRATING SOLAR THERMAL POWER (CSP).
More than 450 megawatts (MW) of CSP was installed in 2011, bringing global capacity to almost 1,760 MW. Spain accounted for the vast majority of capacity additions, while several developing countries launched their first CSP plants and industry activity expanded its attention from Spain and the United States to new regions. Parabolic trough plants continued to dominate the market, but new central receiver and Fresnel plants were commissioned during 2011 and others were under construction. Although CSP faced challenges associated with rapidly falling PV prices and the Arab Spring, which slowed development in the Middle East and North Africa region, significant capacity was under construction by year’s end.
 click to enlarge
GEOTHERMAL HEAT AND POWER.
Geothermal energy provided an estimated 205 TWh (736 PJ) in 2011, one third in the form of electricity (with an estimated 11.2 GW of capacity) and the remaining two-thirds in the form of heat. At least 78 countries used direct geothermal energy in 2011. Most of the growth in direct use was associated with ground-source heat pumps (GHP), which can provide heating and cooling and have experienced growth rates averaging 20% annually. Geothermal electricity saw only modest expansion in 2011, but the rate of deployment is expected to accelerate with projects under development in traditional markets and the movement into new markets in East Africa and elsewhere. While expansion in the geothermal power industry is hampered by high risk inherent in the development of new resources and lack of awareness, geothermal power is advancing due to the development of new technologies, such as binary-cycle plants and hydraulic enhancement (EGS), which are expanding the range of producible resources and improving the economy of existing plants.
 click to enlarge
HYDROPOWER.
An estimated 25 GW of new capacity came on line in 2011, increasing global installed capacity by nearly 2.7% to approximately 970 GW. Hydropower continues to generate more electricity than any other renewable resource, with an estimated 3,400 TWh produced during 2011. Asia was the most active region for new projects, while more mature markets focused on retrofits of existing facilities for improved output and efficiency. Hydropower is increasingly providing balancing services, including through expansion of pumped storage capacity, in part to accommodate the increased use of variable solar and wind resources. Companies reported increased sales in 2011, and large manufacturers have been investing in new plants and acquiring smaller firms to address billions of dollars in backlogs.
 click to enlarge
OCEAN ENERGY.
After years that saw development of only small pilot projects, global ocean power capacity almost doubled in 2011. The launch of a 254 MW tidal power plant in South Korea and a 0.3 MW wave energy plant in Spain brought total global capacity to 527 MW. A number of additional projects—small pilot-scale and utility-scale—were under development in 2011, designed to test and demonstrate various technologies for full commercial applications in the near future. Continued investment and strategic partnerships are coalescing around several key wave and tidal technologies that look poised for deployment on a large scale in coming years.


 click to enlarge
 click to enlarge
 click to enlarge
 click to enlarge
 click to enlarge
 click to enlarge
 click to enlarge
 click to enlarge
 click to enlarge
 click to enlarge
 click to enlarge
 click to enlarge
 click to enlarge
 click to enlarge
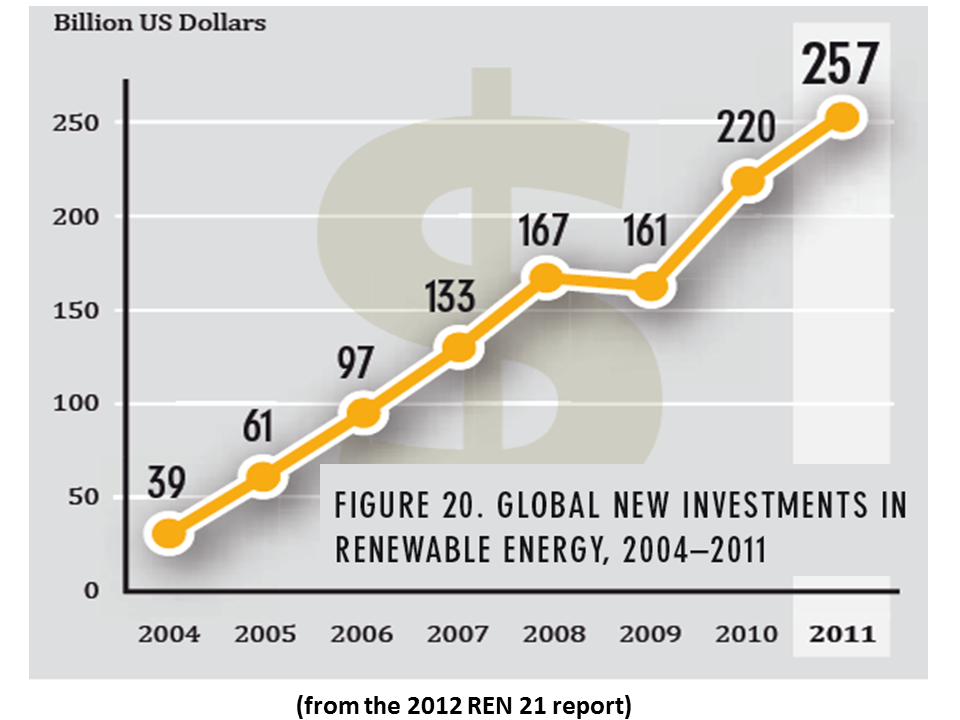 click to enlarge
 click to enlarge
 click to enlarge
 click to enlarge
 click to enlarge
 click to enlarge
 click to enlarge
 click to enlarge
 click to enlarge
 click to enlarge
 click to enlarge
 click to enlarge
 click to enlarge
 click to enlarge
 click to enlarge
 click to enlarge
 click to enlarge
 click to enlarge
 click to enlarge
 click to enlarge
 click to enlarge
 click to enlarge
 click to enlarge
 click to enlarge
 click to enlarge
 Plug-in Hybrids, The Cars That Will Recharge America
 Oil On The Brain


