ORIGINAL REPORTING: New Power System Approaches To Customer-Owned Generation
Rethinking California distribution system operations and grid services markets for a high-DER future; California wants a cost-effective, reliable and equitable power system with well-compensated distributed resources to balance the bulk power system and meet local needs.
Herman K. Trabish, June 7, 2022 (Utility Dive)
Editor’s note: Integrating customer-owned resources into the power system requires settling the complex question of whether utilities or customers and their representatives will control them.
To prepare California for a “high DER future” that could overstress the state’s distribution system, a series of regulatory workshops opened May 3. Distribution system reform is needed as California moves from “firm dispatchable one-way generation to variable two-way generation” that will accelerate the impacts of distributed energy resources, a white paper introducing the California Public Utilities Commission stakeholder-led workshops reported. The paper offered potential distribution system operator, or DSO, models that could meet coming needs.
“By DSO or another name, a different model of the distribution utility is needed, because in the future every electricity user can have DER and participate in an open access distribution network,” Lorenzo Kristov, consultant for electric system policy, structure, and market design to climate and energy policy advocates, The Climate Center, told Utility Dive. But “right now, the need for a DSO is more concrete than the DSO concept,” he added.
The workshops will develop “alternative roles and responsibilities of the distribution utility,” said Gridworks Executive Director Matthew Tisdale, who is leading the series of CPUC workshops. But those roles and responsibilities “are enormously financially and politically complicated” and “probably the most fundamental, contentious, and difficult issue in energy policy.”
Two insights about California’s distribution system work emerged from the May 3 workshop, though neither identified the state’s eventual DSO model. First, it was clear there is strong contention between some power system incumbents and community representatives on critical proceeding points, including who can participate and how to define a DSO. And second, it appears major regulatory reforms that could impact utilities’ earnings, like performance-based regulation, are part of the discussion.
Though rooftop solar is currently threatened by a Commerce Department inquiry and California’s net metering reconsideration, the state’s DER growth will accelerate, workshop participants agreed. Customer demand, the state’s zero emissions by 2045 goal, evolving technology, and falling prices will be key drivers, the white paper added. California installed distributed solar photovoltaic capacity is expected to increase from 2022’s 14,048 MW to 24,721 MW in 2030, according to California Energy Commission spokesperson Michael Ward’s review of the commission’s 2021 Integrated Energy Policy Report. Distributed energy storage capacity is projected to increase from 2022’s 740 MW to 2,587 MW in 2030, he added.
California’s estimated 839,000 zero-emission vehicles at the end of 2021 are projected to reach 5.7 million light-duty passenger and medium- and heavy-duty vehicles by 2030, Ward added, citing CEC data. And an estimated 1.5 million households had smart thermostats in 2018, according to the commission’s 2019 Residential Appliance Saturation Study, though they were too few to count in its 2009 study. Gov. Gavin Newsom’s, D, Executive Order N-79-20 targeting 100% zero-emission new passenger vehicle sales by 2035 is expected to drive exponential growth, the CPUC white paper said. Assembly Bill 327, a 2013 provision that protects customer-owned resources, programs supporting battery storage and heat pumps, and utility and private sector policy-led rebates and initiatives, will all add to accelerating DER growth, it added… click here for more
New Tax Credits For New Energy
Renewable Energy Incentives from the Inflation Reduction Act
November 29, 2022 (Marcum Accountants and Advisors)
“…[The Inflation Reduction Act (IRA) signed into law by President Biden on August 16, 2022, is] the most significant piece of legislation for the renewable energy and storage space in almost 20 years…[Its extends federal tax incentives of] up to $369 billion for new solar, wind, thermal, and energy storage devices over the next decade…[It extends and expands] the Investment Tax Credit (ITC) through December 31, 2025, for solar, wind, geothermal, biogas, combined heat and power (CHP) facilities, and microgrid projects that begin construction before December 31, 2025…
…[It also] includes other technologies, such as carbon capture sequestration (CCS), clean hydrogen, nuclear power, and biofuel…[It] also extends the Production Tax Credit (PTC) for wind, biomass, geothermal, solar, landfill gas, and other projects…To claim the [full value of the] enhanced 30% ITC and 2.6 cents kilowatt (kWh) PTC, solar developers and their sub-contractors must [provide apprenticeships and] use union labor or prevailing wages …
...[Credits can be increased if projects use] domestically produced materials, such as steel and iron (100% U.S.-made), and the total materials for the project are at least 40% U.S.-made…[and if they located at a brownfield] or a [low-income] environmental justice area…[Project developers] can transfer ITC or PTC to a third party [and make arrangements for use of them with tax-exempt entities]…This provision creates a new marketplace for tax credits…[The passage of the IRA will help] create more clean, renewable energy for our country.” click here for more
Monday Study – The West’s Market Opportunity
CAISO EDAM Benefits Study Estimating Savings for California and the West Under EDAM Market Scenarios
Keegan Moyer and Daniel Ramirez, November 4, 2022 (Energy Strategies)
Study Background>/span>
• The CAISO engaged Energy Strategies to estimate the benefits associated with the CAISO’s Enhanced Day-Ahead Market (EDAM)
o The purpose of the study was to estimate both operational and capacity savings that may accrue due to the formation of the CAISO’s new day-ahead market known as EDAM
o The benefit estimates were calculated for (1) California; and (2) the Western US states in the Western Interconnection
• The methodology and underlying databases used to perform the assessment were consistent with those adopted by Energy Strategies in performing the State-Led Market Study, which was an analysis conducted for the benefit of Western states with funding through a US Department of Energy grant
o The State-Led Market Study was published in July 2021 and with the goal of helping Western states independently and jointly evaluate benefits of generic organized electricity market expansion options, while enhancing regional dialog on related regulatory and policy issues impacting states
o The study featured detailed modeling that forecasted the operational benefits, as well as capacity savings, that could accrue to individual states under future market scenarios
o The modeling explored generic representations of real-time, day-ahead, and RTO market constructs, assuming their implementation across a series of hypothetical footprints selected by the Western states
o This EDAM assessment differs from this prior work in that it is designed to represent specific elements of a market proposal, whereas the State-Led Study was intentionally generic and not focused on representing a particular market proposal or design
Study Goal
Estimate savings for California and the aggregation of Western States assuming a Westwide EDAM footprint, considering both operational efficiencies and load diversity benefits that may accrue in the year 2030
Operational Savings are Focus of Study
• This CAISO EDAM study focuses on operational benefits of future regional wholesale power markets, featuring modeling intended to reflect specific aspects of the CAISO EDAM proposal
o The study sources capacity savings directly from public State-Led Study results
• Operational benefits reflect a relatively small portion of the benefits caused by organized wholesale energy markets
Market Benefit Categories
Operational Savings
Savings due to more efficient dispatch (via SCED), more efficient management of transmission capacity, lower operating reserve requirements, removal of transmission wheeling costs within market footprint, decrease in trading friction
Capacity Savings
Savings due to lower and regionally shared planning reserve requirements caused by geographical diversity of loads (and generation)
Other Energy Related Savings
Savings due to more efficient planning of the transmission system, access to lower-cost public policy resources, environmental benefits of reduced emissions, new market products (e.g., hourly vs. block), increased automation of system operations
Non-Energy Savings
Savings due to lower electricity prices causing indirect economy-wide benefits such as new jobs, changes to household spending, and economic growth
Adjusted Production Cost (APC) is Primary Metric to Measure Operational Savings
• Adjusted Production Cost (APC) is a metric commonly used to estimate operational benefits in market studies as it accounts for power trading between buyers and sellers
o APC represents the net costs for a given area to serve load, accounting for power generation costs, power purchase cost, and revenues from sales
• A decrease in APC for an area from one market scenario to the next represents operational savings
o This study calculates APC on a balancing area (BA) basis and allocates BA-level operational savings to states based on the amount of BA load in that state
• By comparing changes in APCs, the study estimates how states might experience operational benefits from CAISO EDAM market configurations
Modeling EDAM: Key Assumptions to Represent Market
Wheeling costs: Transmission wheeling costs or “hurdle rate” between EDAM participants are removed. UC and DA dispatch are optimized together.
Transmission available to market: 100% of inter-area transfer capability is available for EDAM day-ahead market optimization
CAISO export limit: No MW cap on how much power CAISO can export under EDAM
Contingency reserves: No change in BA and reserve sharing group obligations due to EDAM market formation – status quo modeling retained
Regulating reserves: No change to assumption that BAs define and hold regulating reserves locally – Status Quo modeling retained
Load following / imbalance reserves: Assumes EDAM imbalance reserve product causes imbalance reserves to be calculated and held for entire EDAM footprint (versus individual BAs under Status Quo)
Carbon markets: No change to California carbon price or carbon cost applied to unspecified imports per AB32 – Status Quo modeling retained
Real-time market representation: 100% of inter-area transfer is available for real-time dispatch with no hurdle rate, among market participants in EDAM
Study Results: West-wide EDAM Scenario
Scenario assumes that all Western balancing areas join EDAM market, which features a market-based imbalance reserve product, no transmission wheeling costs among market participants, and 100% transmission availability for market optimization
• An EDAM footprint across WECC causes California operational costs to decline by 6.2% from the Status Quo o Due to increased load diversity across the market footprint, California achieves capacity savings of $95 million per year
• In sum, California saves $309 million per year under a west-wide EDAM
• States outside of California also see efficiencies, especially those caused by load diversity, collectively saving $886 million per year
• Total savings for the region due to EDAM is nearly $1.2 billion per year
Study Results: Change in Energy Transfers due to West-wide EDAM…Change in Renewable Output due to West-wide EDAM…Comparison of Energy Transfers and Renewable Curtailments for West-wide EDAM Scenario…
Study Results: Comparison to RTO Futures
• By comparing EDAM results to those estimated in the State-Led Market Study for equivalent RTO footprints, we see that the EDAM achieves 74% of RTO operational savings for California, and 81% of RTO operational savings for the remaining Western states
• EDAM, as envisioned in this study, has a market design that removes transmission wheeling costs, consolidates imbalance reserves, and opens up inter-area transfers available for market optimization
Sensitivities…Imbalance Reserves and Geographic Diversity…Imbalance Reserve Sensitivity…
Key Takeaways
The CAISO EDAM has the potential to reduce operational costs in California by $214 million per year if the market footprint covers the entire West
o These savings represent a decrease in operational costs of 6.2% in California (from the Status Quo)
o Other Western states, in aggregate, see $329 million in annual operational savings (↓ 4.5% from Status Quo)
o In addition, the EDAM market could help avoid nearly 3 million tons of CO2 per year The inclusion of an imbalance reserve production in the CAISO EDAM is critical to the efficiency of the market as it drives 60% of California’s operational savings forecasted for EDAM
o Removing the imbalance product from the EDAM market design causes California’s benefits to decrease by $128 million per year
o Other Western States operational benefits are also similarly compromised when the imbalance product is removed (benefits ↓$229 million/year)
EDAM is estimated to achieve 78% of operational savings forecasted for an RTO with the same WECC-wide footprint o The components of EDAM market design reflected in this study capture many of the efficiencies offered by an RTO If capacity savings are realized due to the formation of EDAM, total market benefits may reach $309 million per year for California, and $1.2 billion per year for all Western states (combined, including California)…
ORIGINAL REPORTING: The New Energy Transition Needs Better Power System Regulation
‘Dramatic shift’ in utility regulations, better pilot designs needed to propel energy transition, DOE report finds; Innovation in regulation can greenlight a more affordable, reliable clean power system, stakeholders report
Herman K. Trabish, May 31, 2022 (Utility Dive)
Editor’s note: Regulators can clear the way for a transition to New Energy or they can obstruct it.
The speed of today’s power sector transition requires regulatory innovation that matches its pace, regulators, as well as utility and technology advocates, agreed in a new Department of Energy paper.
New power system technologies and operations can no longer await regulatory approval in litigated multi-year rate cases, said co-authors of the report, The Role of Innovation in the Electric Utility Sector, published in April by the Department of Energy's Lawrence Berkeley National Laboratory. Such delays increase the risk that states will fail to meet the rapidly growing need for new reliable, affordable, clean and equitable electric service solutions, they added.
“Regulatory innovation is needed to meet new decarbonization mandates and goals and the accelerating pressures of climate change,” Commissioner Tremaine Phillips of the Michigan Public Service Commission agreed. In response, Michigan and other states have initiated informal collaborative proceedings “to enable utilities to keep up with today’s energy transition.”
But inertia is designed into regulatory processes to protect power sector stakeholders’ many different interests, the paper's contributions from the National Association of State Utility Consumer Advocates, the BlueGreen Alliance, the Institute for Electric Innovation, Sunrun and Build Edison showed.
More informal and collaborative proceedings "that engage people in problem solving across different interests can be exhausting,” said Regulatory Assistance Project President and CEO, and former Vermont Department of Public Service Commissioner, Richard Sedano. But those proceedings have more time and latitude to address "the full dimension of innovative ideas and not just whether they are right or wrong" and "can drive solutions,” he added.
New approaches to regulation could, however, unjustly shift the risk of failure from utilities to ratepayers, the paper's consumer advocates wrote. Yet answers to key questions about the costs and benefits of efforts like pilot projects to test solutions are already emerging from new regulatory initiatives, regulators and utility and technology advocates told Utility Dive.
New regulatory approaches are needed where state commissions have discouraged utility investments to improve reliability and affordability and accelerate decarbonization, according to LBNL Electricity Markets and Policy Department Manager and Strategic Advisor Lisa Schwartz, the paper’s technical editor. But utilities invest only an estimated 3% of profits in research and development while more competitive industries invest 40% or more, Schwartz reported from … click here for more
EPA Proposes Quadrupling The Carbon Cost To $190/Tonne
EPA floats sharply increased social cost of carbon
Niina H. Farah and Lesley Clark, November 21, 2022 (EandE News)
“EPA has proposed a new estimate for the social cost of carbon emissions, nearly quadrupling an interim figure that has already drawn legal challenges from a host of Republican-led states…The metric puts a price tag on the damages created by each metric ton of greenhouse gas emissions…from power plants and automobiles to the oil and gas sector…The Biden administration has been using the Interagency Working Group’s interim value of $51 per metric ton of CO2. But earlier this month, EPA quietly proposed increasing that number to $190…
The administration’s use of the IWG’s interim social cost of greenhouse gases has been challenged in parallel lawsuits led by Louisiana Attorney General Jeff Landry and Missouri Attorney General Eric Schmitt, both Republicans… [It was] first developed by the Obama administration, adjusted for inflation. Environmental groups and others eager for more stringent climate action have pressed the administration to increase that value…[which] is far more than the Trump administration, which used a value of just $1 per metric ton…
…[Landry and Schmitt argued] Biden lacked the authority to raise the key climate metric under the Constitution…[The Biden administration has scored] victories in court defending the current interim metric of $51 per metric ton… [EPA’s new proposal estimates the social cost of carbon as $120, $190 or $340 per metric ton of CO2, using discount rates of 2.5 percent, 2.0 percent and 1.5 percent. The higher rate means a lower dollar value is assigned to future impacts; a lower rate assigns more value to those future harms. It] will now have to undergo an independent peer-review process…” click here for more
Monday Study: The Benefits of Big Transmission Across The U.S. East
Economic, Reliability, and Resiliency Benefits of Interregional Transmission Capacity Case Study Focusing on the Eastern United States in 2035
September 2022 (General Electric Energy Consulting and Natural Resources Defense Council)
Executive Summary
The United States electric grid is in a state of transition. The country is shifting towards lower carbon sources while facing more frequent extreme weather events that challenge the ability to keep the lights on. Greater grid flexibility is the key to reliable decarbonization in the face of uncertainty. One of the most cost-efficient forms of flexibility while maintaining resiliency is greater reliance on interregional imports and exports of electricity.
GE Energy Consulting (GE) knows the value of interregional flexibility from its own study experience. Back in our 2010 Western Wind and Solar Integration Study, GE and the National Renewable Energy Laboratory (NREL) identified the value of higher interregional flexibility to support California’s decarbonization goals. This work helped support the 2014 launch of the Western Energy Imbalance Market that is operating today and has enabled over $2B in gross benefits across its 17 members.
In this study, we broaden our perspective to ask and illustrate the more general question: What are the benefits of interregional transmission? Answering this question should be based on the three types of ratepayer benefits:
Resiliency
Interregional transmission expansion can lower the overall capacity required given grid uncertainty. In the face of frequent and extreme weather events, interregional transmission expansion can allow access to generation that otherwise would not have been accessible and minimizes the likelihood (or in the worst case, the impact) of shedding load (i.e., blackouts). In addition, a reduction in overall generating capacity is needed as interregional capacity takes advantage of diversity in load shapes. Stability With the shifting generation mix comes increased reliance on inverterbased resources. Interregional capacity can strengthen voltage, which is especially important for regions with large amounts of high inverter-based resources. Interregional transmission can reduce the amount of generation capacity that is required for meeting such stability needs.
Affordability
Interregional transmission expansion allows ratepayers with expensive generation to access generation from areas with less expensive generation. By enabling greater transmission access to these low-cost resources, ratepayers with more expensive generation can benefit.
Stability
With the shifting generation mix comes increased reliance on inverterbased resources. Interregional capacity can strengthen voltage, which is especially important for regions with large amounts of high inverter-based resources. Interregional transmission can reduce the amount of generation capacity that is required for meeting such stability needs.
In this study, GE modeled generation differences between a transmission-constrained and an unconstrained transmission grid to estimate the resiliency, economic and stability benefits. GE found that fully unconstraining the transmission system in the Eastern Interconnection (EI) would result in limited to no loss of load during extreme weather events and $12 billion in net benefits. GE believes these benefits are conservative due to a number of factors including:
• Study evaluated average power flows between regions rather than maximum power flows;
• Study assumed all regions maintained resource adequacy, and for estimating capacity and ancillary service savings, assumed a flat reserve margin rather than conducting a loss-of-load-expectation analysis;
• Many assumptions in GE’s production cost model were locked in place in April 2022 to maintain the integrity of the comparative analysis conducted for this study. Had the study included 2022 updates to load forecasts, which incorporated more aggressive electrification assumptions by Independent System Operators, and most recent natural gas price forecasts, GE believes the benefits would have been higher. Nevertheless, the benefits of interregional transmission are significant and are highlighted in this study.
GE also recognizes that the production cost modelling conducted for this study assumes rational economic behavior and that all stakeholders in the Eastern Interconnect would utilize the increased transmission capacity by increasing exports and imports to and from neighboring regions. There are a number of operational and planning limitations which could limit the realization of potential benefits of increased interregional transmission. Examples of limitations could include operational governance of the commitment and dispatch decisions of imports and exports in both dayahead and real-time markets; planning requirements limiting imports to serve a regional grid in all but the most limited circumstances; and sharing of resources to meet reserve margins across multiple jurisdictions. This study is designed to exemplify the benefits of increased interregional transmission and does not specifically address potential barriers to those benefits…
Conclusions
This report illustrates the broad range of benefits of expanded interregional transmission. GE determined the incremental interregional transmission needed via an increase in average power flows enabled by unconstraining transmission across normal and extreme weather events. These example simulations showed that:
• Greater incremental interregional transmission can avoid load shedding during multiple types of extreme weather events. In the example cases presented, power losses due to extreme weather cost $875 million - $1 billion.
• Greater incremental interregional transmission enabled ~$3-4 billion/year production cost savings under normal weather conditions.
• More interregional transmission could result in upwards of $12 billion in net benefits. Although costs for more intra-regional transmission are not included in t
his estimate, this net benefit estimate is likely low as noted earlier in this analysis.
• Grid stability is increasingly a factor in grid resiliency. An AC interregional transmission capacity requirement can increase grid stability, but alternate technologies may provide greater stability benefit such as DC transmission ties
ORIGINAL REPORTING: New Ideas For Lowering Electricity Rates
California’s ‘affordability crisis’ attracts innovative ratemaking and regulatory proposals; Double-digit year-on-year spikes in electricity rates are leading California regulators and stakeholders to search for ways to protect climate goals and rate affordability.
Herman K. Trabish, May 19, 2022 (Utility Dive)
Editor’s note: The income-based fixed charge is gaining momentum but calls for public funding and better regulatory oversight continue.
Groundbreaking new affordability evaluation criteria and metrics to manage California’s skyrocketing electricity rates are a step forward but not enough, regulators and stakeholders agreed at the state’s second annual electricity rates affordability conference Feb. 28.
Despite the falling costs of wind and solar generation, California’s electricity rates are rising due to costs related to wildfires, legacy assets, and public purpose programs, the California Public Utility Commission’s 2019 Annual Affordability Report, published in April 2021, concluded. As a result, a “substantial number of households” face “a double burden of expensive service and a low ability to pay for it,” the report said.
The severity of California’s “affordability crisis” for low-income customers has yet to be measured, but it “is beginning to impact middle-class households,” Senior Policy Expert Jennifer Dowdell of ratepayer advocacy group The Utility Reform Network told Utility Dive. She applauded the new CPUC criteria and metrics and other conference input because “the state needs all parties’ proposals.”
There is “no panacea” for electricity affordability, and a “portfolio” of solutions will be needed, especially because “some cost drivers, like global fuel prices, are outside our control,” CPUC Commissioner Darcie Houck cautioned. The commission is studying the conference’s many proposals for actions the state can take “for controlling costs and mitigating rates,” she added.
The Feb. 28 California affordability conference began with a discussion of the new evaluation criteria and metrics. But much of the content was about electricity ratemaking reforms, new ways to fund public programs, innovations in regulatory oversight, and a potential breakthrough in equity with redesigned fixed charges for low-income customers… click here for more
New Energy Has Saved Texas $28BIL
Texas Solar and Wind Resources Saved Consumers Nearly $28 Billion Over 12 Years: Report
Elizabeth McCarthy, October 25, 2022 (Utility Dive)
“Solar and wind energy reduced wholesale energy costs in Texas by $7.4 billion in the first eight months of this year, creating average monthly savings of $925 million…[and according to IdeaSmiths, solar and wind resources have saved Texas residents nearly $28 billion over the past 12 years…With natural gas and coal prices at 10-year highs, Texas residences and businesses are on track to save an estimated $11 billion this year…[Renewables have] also has reduced air pollution, including carbon dioxide, nitrogen oxides and sulfur oxide emissions, and curbed the use of limited water supplies…
…Texas leads the U.S. in wind installations, with 30.46 GW, and is second in solar energy, with 8.6 GW…[Renewables have lowered wholesale electricity market prices] by offsetting more expensive power plants…[and consumer savings have] been larger this year because of increased wind and solar generation as well as natural gas and coal prices that were much higher than they were in earlier years… [The very hot Texas summer also drove up demand,] increasing the value of grid-connected renewables…
…[Renewable-generated electricity displaced fossil fuels which] avoided 416,000 tons of SO2, 318,000 tons of NOx, and 558 million tons of CO2 emissions since 2010…[The avoided emissions led to] fewer hospitalizations of patients suffering respiratory impacts…[That has saved Texans and estimated $10.2 billion to $76.4 billion] in healthcare and other environmentally related costs…[Avoided consumption of water used in fossil fuel plants led to estimated savings] between $0.7 billion and $1.7 billion.” click here for more
Monday Study – The Costs And Benefits Of Connecting New Generation
Interconnection Cost Analysis in the Midcontinent Independent System Operator (MISO) Territory; Interconnection costs have escalated as interconnection requests have grown
Joachim Seel, Joe Rand, Will Gorman, Dev Millstein, and Ryan Wiser,
October 2022 (Lawrence Berkeley National Laboratory); Will Cotton, Nicholas DiSanti, and Kevin Porter (Exeter Associates)
Executive summary
Interconnection queues have grown dramatically throughout the United States. In MISO, the cumulative capacity of projects actively seeking interconnection more than doubled from 2016 through 2021. Based on available data on project-level interconnection costs from MISO, our analysis finds:
• Average interconnection costs have grown. Project-specific costs can differ widely depending on many variables. We focus on average costs as a key cost metric. For projects that have completed all required interconnection studies (dubbed “complete” request status), average costs have nearly doubled (to $102/kW) for more recent projects relative to costs from 2000-2018 ($58/kW). Projects still actively moving through the queue (“active”) have estimated costs that have more than tripled just over the last four years, from $48/kW to $156/kW (2018 vs. 2019-2021).
• Projects that have completed all required interconnection studies have the lowest costs. Costs averaged $102/kW for complete projects from 2019 through 2021. Projects that are actively progressing through the study process but have not yet completed all studies have higher costs ($156/kW), while the interconnection requests that ultimately withdraw from the queue (“withdrawn”) face the highest costs ($452/kW)—likely a key driver for those withdrawals.
• Broader network upgrade costs are the primary driver of recent cost increases. Costs for local facilities at the point of interconnection are similar for complete ($46/kW) and active ($48/kW), but larger for withdrawn projects ($67/kW). Costs for broader network upgrades beyond the interconnecting substation explain most cost differences and have risen sharply. Estimated network upgrade costs have grown since 2018, to $57/kW for complete projects and $107/kW for active projects. Among withdrawn projects, they make up 85% of the costs at $388/kW for recent projects.
• Potential interconnection costs of wind ($399/kW), storage ($248/kW), and solar ($209/kW) have been greater than natural gas ($108/kW) projects in recent years (2018-2021). Wind projects bear the greatest costs compared to other resource types: Wind projects that completed the interconnection study process in 2021 faced a record average of $252/kW, nearly four times the historical average and about 16% of typical total wind installation costs in MISO. Wind projects that ultimately withdrew had average
interconnection costs of $631/kW (equivalent to 40% of total project installed costs), compared with $358/kW (or 24% of installation costs) for withdrawn solar applicants.
• Larger generators have greater interconnection costs in absolute terms, but economies of scale exist on a per kW basis. Medium-sized wind ($491/kW) and solar ($259/kW) projects face twice the potential interconnection costs per unit of capacity compared to very large wind ($222/kW) and solar ($125/kW) projects.
• Interconnection costs also vary by location, with projects in the eastern part of MISO (Indiana and Illinois) reporting overall lower costs, irrespective of request status ($50-70/kW). Applicants in the north (North and South Dakota) and parts of Texas have high potential interconnection costs (average of $508-915/kW).
The cost sample analyzed here represents nearly 50% of all projects requesting interconnection from 2010 to 2020, or 30% when going further back in time to the year 2000. While it is sufficiently robust for detailed analysis, much data remains unavailable to the public. The paucity of easily accessible interconnection cost data poses an information barrier for prospective developers, resulting in a less efficient interconnection process. We have posted project-level cost data from this analysis at https://emp.lbl.gov/interconnection_costs.
1. The interconnection queue doubled in capacity over the past few years
As of the end of 2021, the Midcontinent Independent System Operator (MISO) had over 160 gigawatts (GW) of generation and storage capacity actively seeking grid interconnection. This “active” capacity in MISO’s queue is dominated by solar (112 GW) and, to a lesser extent, wind (22 GW) power capacity. MISO’s queue also contains additional data for projects that are no longer actively seeking interconnection: 366 GW of projects have withdrawn their application and 62 GW of projects are already in service (Rand et al. 2022). Submissions for MISO’s 2022 Generator Interconnection Queue again broke all records, increasing by 220% over 2021 levels. If all submissions are accepted as valid, the active MISO queue would balloon to 289 GW, more than 95% of which are either renewable power or energy storage (MISO 2022). The capacity associated with these requests is more than twice as large as MISO’s peak load in recent years (about 120 GW) and, if substantial amounts are built, will likely exert competitive pressure on existing generation. However, most projects have historically withdrawn their applications: only 24% of all projects requesting interconnection between 2000 and 2016 have ultimately achieved commercial operation at the end of 2021.
MISO has implemented numerous interconnection process reforms since 2008 to reduce queue delays and project cancellations. These reforms, for example, shifted MISO’s procedures for processing interconnection requests away from a “first-come, first-served” serial approach to a “first-ready, first-served” cluster study approach with annual cluster windows in each of the five MISO regions. In 2016, MISO introduced new “at risk” payments to enhance project readiness at interim milestones and, starting with the 2020 queue cycle, MISO established more stringent site control requirements for projects to progress through the queue (Bergan et al. 2012; Caspary et al. 2021). MISO has also increased efforts to expand the transmission network. The ISO recently approved $10 billion of new bulk transmission, while their Joint Targeted Interconnection Queue initiative aims to invest $1 billion to address transmission needs along the MISO-SPP seam.
2. Cost sample represents nearly 50% of projects requesting interconnection over the past decade
This brief analyzes interconnection cost data from 922 projects that were evaluated in interconnection studies between 2001 and 2021, equivalent to 28% of all projects requesting interconnection to the MISO system during that time (see left panel in Figure 1); the cost sample increases to 48% of projects when focusing on a more recent time period of 2011 through 2020.
Our interconnection cost sample has two sources:
• All data that were available in the MISO system as of February 2022: 698 projects (MISO 2022).
• Data for 224 additional projects that were already collected in 2018 and that had since been removed from the online MISO system (Gorman, Mills, and Wiser 2019).
While the sample is sufficiently robust to enable detailed analysis of interconnection costs, it represents a subset of all projects. MISO removes detailed interconnection study information after a few years from their publicly accessible records, explaining the paucity of data for earlier years. We were also not able to analyze costs for projects entering the queue in 2021 and beyond as interconnection studies with cost estimates are performed and published with some delay. The lack of easily accessible interconnection cost data poses an information barrier for prospective developers, resulting in a less efficient interconnection process. We have posted project-level cost data from this analysis at https://emp.lbl.gov/interconnection_costs.
The sample varies over time with respect to request status (see right panel in Figure 1). Data for completed projects goes back furthest in time and makes up the largest portion of our cost sample (370 projects, 56.9 GW). Some projects ultimately withdraw from the interconnection process for a variety of reasons; our data includes 314 such projects (48.1 GW) that were studied between 2018 and 2021. Projects that are still active in the interconnection study process were primarily evaluated in 2021 (total of 238 projects, 37.8 GW).
3. Interconnection costs have grown, driven by network upgrade expenses
Interconnection cost data were collected manually from public interconnection study reports, using the most recent study type available (feasibility studies, system impact studies, and addendums). The interconnection cost data summarized here are based exclusively on cost estimates in interconnection study reports and do not include potential additional interconnection-related expenses that may be borne by a project developer. We assume the reported costs refer to nominal dollars as of the time of the interconnection study and present costs in real $2022-terms based on a GDP deflator conversion. We present interconnection costs in $/kW to facilitate comparisons, using the nameplate capacity of each project…
3.1 Average interconnection costs have grown over time…3.2 Broader network upgrade costs are the primary driver of recent cost increases…3.3 Interconnection costs for wind, storage, and solar are larger than for natural gas…3.4 Larger generators have greater interconnection costs in absolute terms, but economies of scale exist on a per kW basis…3.5 Interconnection costs vary by location…
Monday Study – A Framework To Bring Distributed Energy Resources Into The Power System
The Transition to a High-DER Electricity System’; Creating A National Initiative On Der Integration For The United States
August 2022 (Energy Systems Integration Group)
Executive Summary
Distributed energy resources (DERs)—generation, storage, electric vehicles, and responsive load connected to the distribution system—have the potential to bring a range of benefits to the U.S. electricity system and the customers it serves: demand flexibility, lower greenhouse gas and criteria pollutant emissions, customer choice, competition, rapid innovation, cybersecurity, and enhanced reliability and resilience.1 Enabling DERs to provide these benefits will require ongoing and significant changes in multiple areas—DER interconnection, distribution and transmission planning, data access and communication, distribution system operations, utility regulation, tariffs, electricity markets— that better integrate DERs into electricity systems (referred to as “DER integration”).
Several initiatives, from the Federal Energy Regulatory Commission’s (FERC) Order 2222 (FR, 2020) to California’s Rulemaking on a High Distributed Energy Resources Future (CPUC, 2021), are underway to address DER integration issues. However, these initiatives are limited in jurisdictional and geographical scope and have different areas of focus. They reflect a provincial and piecemeal approach to addressing DER integration issues that will lead to limited national progress toward realizing the benefits that DERs can provide. FERC Order 2222, for example, provides limited guidance on how distribution operators should carry out nondiscriminatory overrides of market dispatch instructions; state regulators and utilities will need to develop solutions.
Currently, individual states, such as California and New York, are developing their own distribution-level solutions to DER integration. While these efforts are reflective of the actions of individual, forward-looking states, this approach is inefficient, as each state has to essentially reinvent the wheel. This situation will lead to a proliferation of disparate standards, terminology, and approaches around DER integration across the United States, which in turn will generate confusion and increase costs among manufacturers, developers, and other DER service providers. It will ultimately result in less access to distribution systems for DER providers, higher DER costs, and lower DER benefits to customers.
Need for a National Initiative on DER Integration
A U.S. national initiative around DER integration issues could help to accelerate national progress on DER integration. This initiative could address three fundamental gaps around DER integration in the United States:
• The lack of a common vocabulary, framework, and vision for thinking about DER integration across different jurisdictions
• The lack of a common understanding around shorter-term, least-regrets strategies for DER integration that are consistent across distribution utilities, including strategies for enhancing distribution and transmission planning, data sharing and communication, distribution operations, and DER interconnection and aggregation review
• The lack of a structured dialogue on solutions to longer-term issues around DER integration, such as the design of distribution system operator (DSO) operations, markets, and regulation; federal-state jurisdictional overlap; independent system operator (ISO) market design; and incentive frameworks for regulated utilities2
A national initiative around DER integration could build on recent, related cross-state initiatives in the United States, such as the National Association of Regulatory Utility Commissioners (NARUC) and National Association of State Energy Officials (NASEO) Task Force on Comprehensive Electricity Planning,3 and could draw from the recent experiences of Australia’s OpEN Energy Networks Project and the United Kingdom’s Open Networks Project. A U.S. national initiative could also build on related Order 2222 efforts, including the Energy Systems Integration Group’s (ESIG’s) report DER Integration into Wholesale Markets and Operations (ESIG, 2022a) (hereafter referred to as the ESIG DER integration report), and related efforts by the Electric Power Research Institute (EPRI, 2022), and Advanced Energy Economy and GridLab (AEE and GridLab, 2022). These efforts describe key challenges that must be solved to facilitate FERC Order 2222 in the short term and expand opportunities for integrating DERs into power systems over the longer term. All highlight the need for, and call for, broader venues that facilitate cross-state knowledge sharing.
This report proposes a national initiative to develop greater consistency and consensus around DER integration in the United States. The report outlines a possible design, process, and governance for a structured work effort that would address the three gaps described above. The report is intended to be useful for multiple audiences, including national-level organizations that may wish to integrate these elements into their ongoing efforts and stakeholders who may be participants in the national initiative.
This report proposes a national initiative to develop greater consistency and consensus around DER integration in the United States. It is intended to be useful for multiple audiences, including national-level organizations that may wish to integrate these elements into their ongoing efforts and stakeholders who may be participants in the national initiative.
The proposed design of this national initiative, in terms of objectives, scope, and execution, draws on the insights from the ESIG DER integration report and the second report in the ESIG series, Lessons Learned for the U.S. Context: An Assessment of UK and Australian Open Networks Initiatives (ESIG, 2022a; 2022b). The initiative would also build on existing efforts, such as the NARUCNASEO Task Force and work by the Electric Power Research Institute on coordination between transmission system operators and distribution system operators. While many of these efforts are focused on specific topics, the national initiative described here is intended to be more comprehensive and provide common reference points that enable broader consensus among stakeholders. The initiative would be broadly inclusive, enabling participation by different kinds of utilities (investor-owned, municipal, cooperative) and their associations (the American Public Power Association, Edison Electric Institute, and National Rural Electric Cooperative Association), regulators, NARUC, and NASEO, as well as participation by jurisdictions that are within and outside of RTOs and ISOs.
We envision a staged approach to a national initiative, with an initial focus on technical foundations and developing a common vocabulary, framework, and vision (Track 1), a subsequent focus on least-regrets strategies (Track 2), and a final focus on initiating structured dialogue to address issues that will require more time to resolve (Track 3). The first two tracks map to five workstreams, each addressing a different category of DER integration issues (see Table ES-1). Some of these workstreams, or elements thereof, may be part of ongoing efforts, and as such would not need to be duplicated in this initiative.4
Creating Common Concepts and Vocabulary, Potential Solutions That Can Be Tailored, and More Alignment Across the Industry
The most important value of a U.S. national initiative around DER integration, relative to each jurisdiction developing solutions independently, is the potential to create common concepts and vocabulary, more standardized solutions to nearer-term DER integration challenges, and more alignment across the industry on how to resolve longer-term challenges. Greater national consensus around DER integration would help to provide distribution utilities and their regulators with more visibility on possible paths forward for DER integration, grid technology manufacturers with more clarity on where to focus innovation, DER developers with more consistency in rules across states, and ISOs with a more discrete set of models for nearer-term and future distribution system planning and operations that they would need to accommodate.
This national initiative would not seek to produce one-size-fits-all solutions to DER integration issues across the United States. The U.S. electricity sector is too diverse and complex, in terms of both industry structure and its federalist regulatory system, for blanket solutions to be effective. Instead, the national initiative would seek to develop a limited number of potential solutions that different jurisdictions and utilities can choose from and tailor to their own conditions. For instance, in some jurisdictions, distribution system operations might be more passive, with the distribution utility having a minimal role in DER operations, whereas in other jurisdictions the distribution system operator may actively dispatch, control, and run markets for DERs. The concepts and strategies developed in a national initiative would need to be broad enough to accommodate different approaches, while at the same time recognizing that different approaches share a common technical foundation in physics, engineering, and economics.
Stakeholder engagement will be a critical and challenging component of a U.S. national initiative around DER integration. The Australian and United Kingdom open networks projects illustrated the importance of stakeholder buy-in for generating meaningful results. The U.S. electricity system is much larger, and its stakeholders are more numerous and diverse. Obtaining stakeholder buy-in will require transparency, broad representation, and opportunities for meaningful input. At the same time, however, the organizers of a national DER integration initiative will need to ensure that it is focused enough to produce actionable results. This report proposes a potential governance structure and stakeholder engagement model that would balance these two imperatives.
 click to enlarge
Design of a National Initiative
The Time Is Right
Designing and implementing an impactful national initiative around DER integration will be challenging. It will require careful attention to both design and process as well as skilled organizers that can effectively balance trade-offs and bridge gaps among stakeholders. To be successful, the initiative would need to provide regulators, utilities, and other stakeholders with common concepts, frameworks, and strategies they can use, while still providing flexibility to tailor them to local needs. Despite the challenges of developing consensus and standardization across such a complex and diverse industry, the potential benefits are significant.
The timing is right for a national initiative. Many jurisdictions are currently struggling with FERC Order 2222 implementation and are beginning to consider how the distribution system should evolve with higher levels of DERs—and they are doing so without the benefit of common technical foundations on nearer-term strategies, a longer-term vision, and transition strategies. A national dialogue could create these common reference points, accelerating progress toward finding solutions to DER integration challenges, and ultimately toward realizing the benefits of DERs…


 click to enlarge
 click to enlarge
 click to enlarge
 click to enlarge
 click to enlarge
 click to enlarge
 click to enlarge
 click to enlarge
 click to enlarge
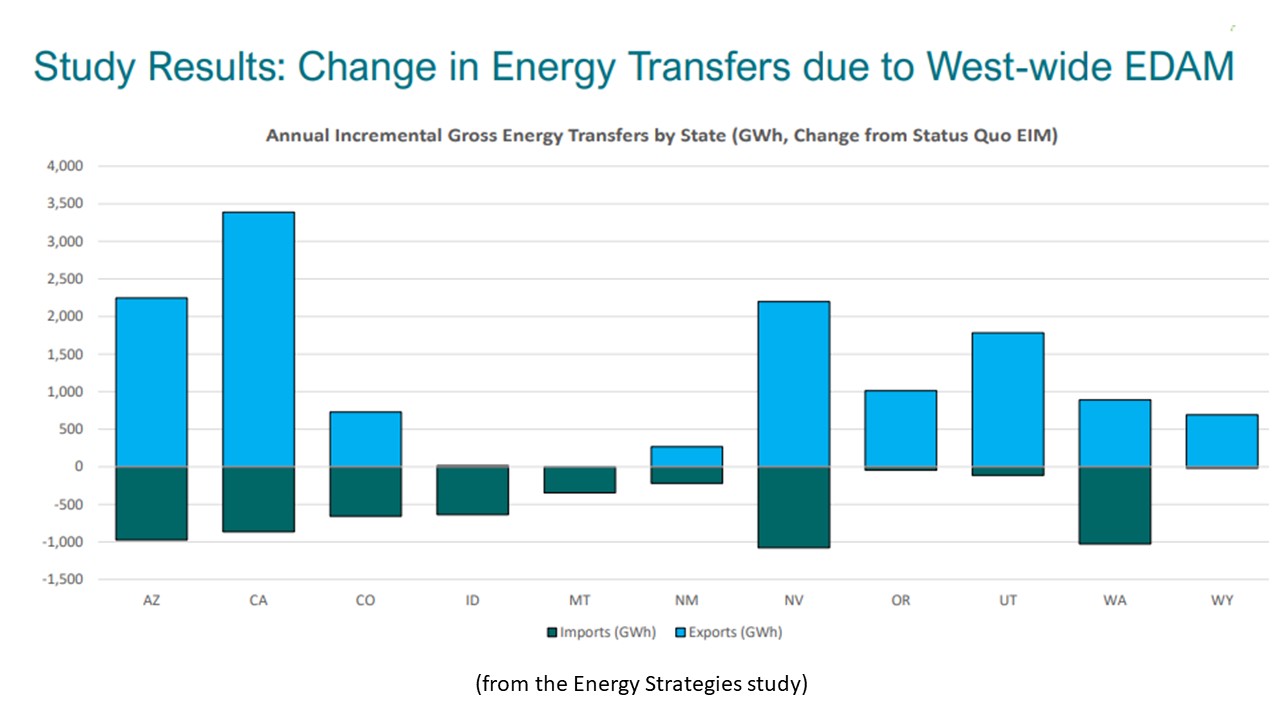 click to enlarge
 click to enlarge
 click to enlarge
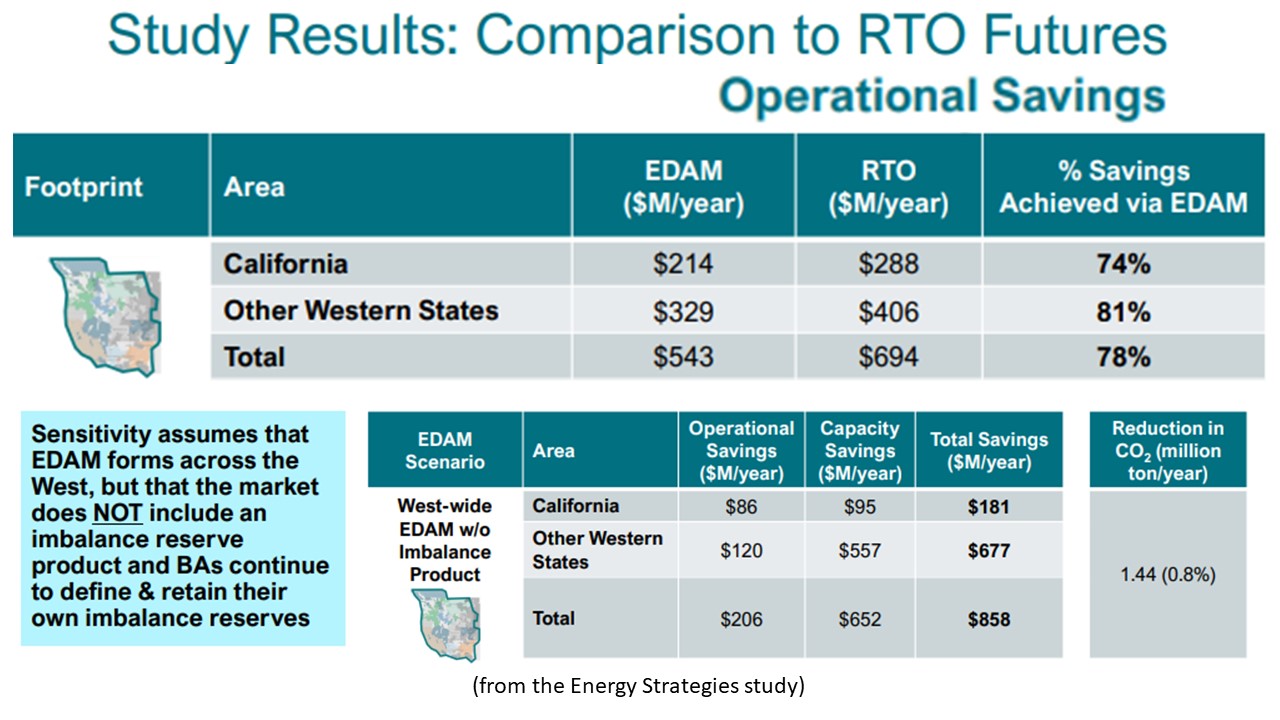 click to enlarge
 click to enlarge
 click to enlarge
 click to enlarge
 click to enlarge
 click to enlarge
 click to enlarge
 click to enlarge
 click to enlarge
 click to enlarge
 click to enlarge
 click to enlarge
 click to enlarge
 click to enlarge
 click to enlarge
 click to enlarge
 click to enlarge
 click to enlarge
 click to enlarge
 click to enlarge
 click to enlarge
 click to enlarge
 click to enlarge
 click to enlarge
 click to enlarge
 click to enlarge
 click to enlarge
 click to enlarge
 click to enlarge
 click to enlarge
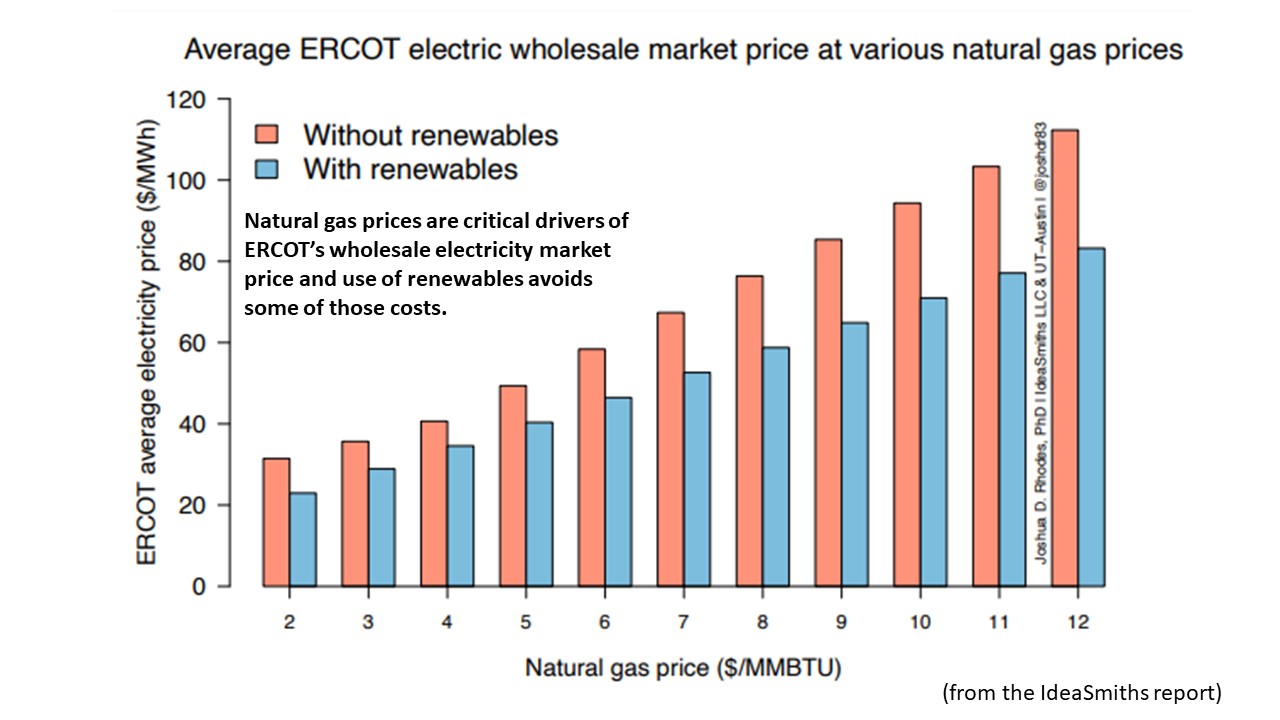 click to enlarge
 click to enlarge
 click to enlarge
 click to enlarge
 click to enlarge
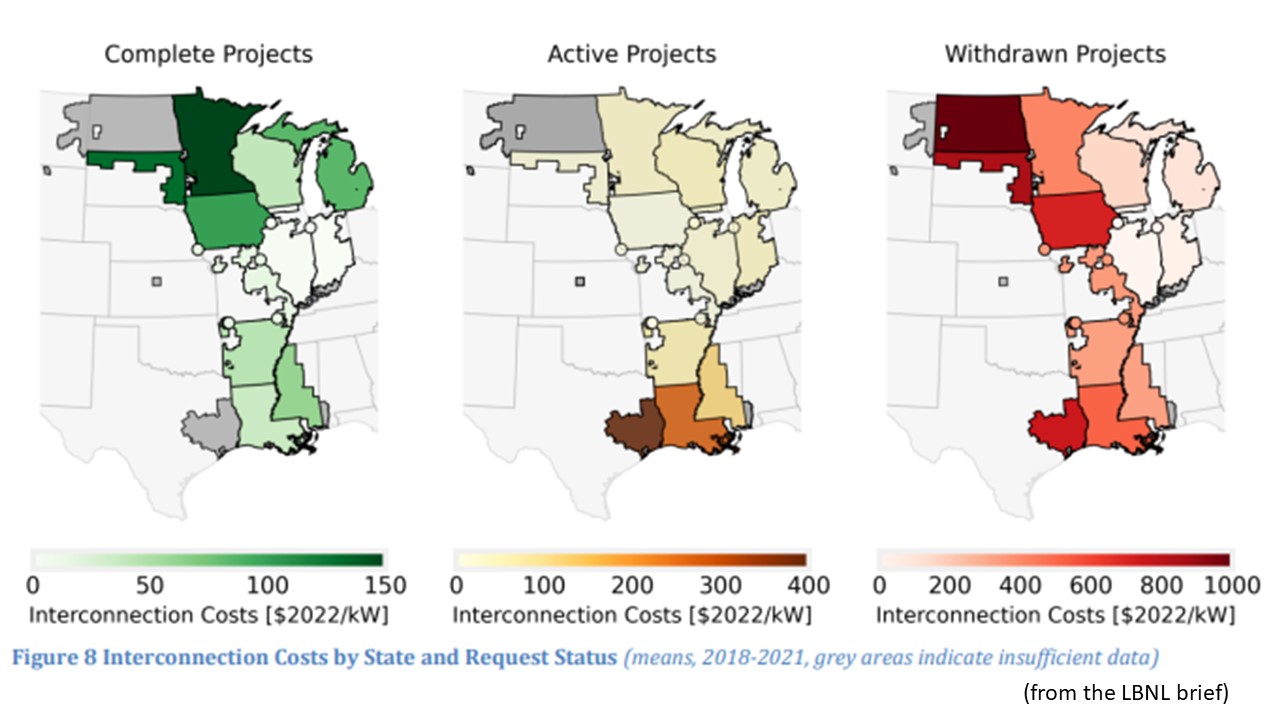 click to enlarge
 click to enlarge
 click to enlarge
 click to enlarge
 click to enlarge
 Plug-in Hybrids, The Cars That Will Recharge America
 Oil On The Brain


